Data
Graphs
Surveys and Bias
Sampling and Experiments
Normal Distribution
100
The mode of the following data set
16 19 17 14 20 20 16 18 20 20
What is 20?
100
Misleading by being wrong
What is incorrect?
100
Guarantees that the data will not be biased
What is Random?
100
The 4 types of sampling methods
What are:
Survey
Experiment
Simulation
Observational Study
100
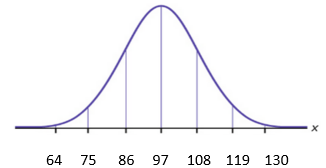
A normal distribution has a mean of 97 and a standard deviation of 11. Draw the curve.
200
The median of the following data set
14 15 16 16 17 18 19 20 20 21 25
What is 18?
200
Manipulative graph that shortens the y-axis
What is Truncated?
200
Biased sampling types
What are:
Cluster
Convenience
Self-selected
200
The control group in the following experiment:
Mr. Stevens wanted to see if his new technique for underwater flips improves the times for the swim team. He teaches the technique to the part of the team that swims backstroke only.
What is the part of the swim team that does not swim backstroke?
200
using the following curve find the percent that is at most 119

What is 97.5%?
300
The mean of the following data set
16 19 17 14 20 20 16 18 20 20
What is 18?
300
Manipulative graph that highlights a certain part of the data
What is Cherry Picking?
300
Types of sampling that is random
What are:
Systematic
Stratified
300
The treatment group in the following experiment:
Mr. Stevens wanted to see if his new technique for underwater flips improves the times for the swim team. He teaches the technique to the part of the team that swims backstroke only.
What is the backstroke swimmers?
300
using the following curve find the percent that is at least 86?
What is 84%?
400
The spread of data
What is range?
400
Manipulates the way the data is displayed to make it appear significantly larger or smaller
What is Exaggerated?
400
Why is the following biased?
“You want to determine which superhero movie franchise – Marvel or DC – is preferred. People were interviewed leaving Avengers Endgame.”
What is cluster?
Only surveyed those coming from a Marvel Movie
400
The flaw in the following experiment:
Mr. Stevens wanted to see if his new technique for underwater flips improves the times for the swim team. He teaches the technique to the part of the team that swims backstroke only.
What is cluster?
Mr. Stevens did not randomize the groups leading to data that doesn't show the whole picture
400
using the following curve find the percent that is between 86 and 130?
What is 83.85%?
500
How data is spread on average in relation to the mean
What is standard deviation?
500
The types of graphs that were taught in this class
What are:
Bar graph
Histogram
Scatterplot
Line graph
Stem and Leaf
Pie Chart
Box and Whisker
Pictograph
500
The sample of the following
In a recent survey of 3000 Medford teens, 35% said they had a job after school
What is
3000 Medford teens
500
The problem with the following experiment:
A researcher wants to test the effectiveness of meditation on blood pressure. The following describes the experimental design:
The researcher is given 100 volunteers who have high blood pressure. 50 of the volunteers meditate. After one month, the patients are evaluated.
What is sample size? The size of the sample is too small.
Will also accept
What is cluster?
They only looked at high blood pressure not normal and low
500
using the following curve find the percent that is within 2 standard deviations of the mean
What is 95%?