Statistical Questions
Mean, Median, Mode
Range, MAD
Dot Plots, Histograms
Box Plots
Spread and Shape
Super Happy Fun Time Amazing
100
True or False: This is a statistical question: How many students got a B on the math test?
What is false. (counting-- one answer)
100
This is the mean of the following data set:
31, 44, 39, 42, 43, 43
What is 40.3 (242/6)
100
This is the range of the following data set:
14, 17, 4, 20, 10, 17
What is 16 (20-4)
100
This is how you determine the number of items in your data set on a dot plot.
What is count the number of dots on the dot plot?
100
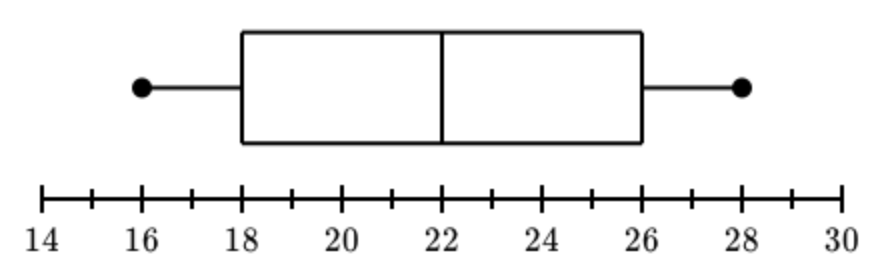
What is the median of this data?
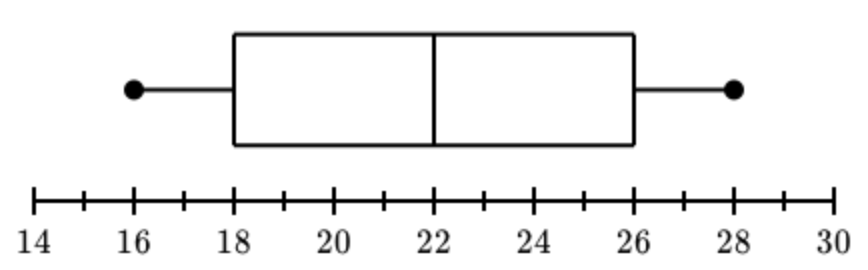
22
100
What is it called when the data roughly goes up and then back down?
Symmetrical
100
What has one head, one foot, and four legs?
A bed
200
Statistical or Not Statistical-- "How many boxes of candy did each student sell?"
What is statistical question. (Variety of answers :EACH student)
200
This is the median of the following data set:
42, 40, 40, 47, 41
What is 41?
200
This is the range of the following data set:
31, 44, 39, 42, 43, 43
What is 13
200
This is how you determine the mode on a dot plot.
What is find the value with the most dots above it.
200
All of the data between Q1 and Q3 account for ___% of the data
50%
200
If the data is not symmetrical, then it is ...
Skewed
200
How many letters are in The Alphabet?
11
300
This is the definition of a statistical question.
What is a question that can be answered with DATA that VARIES.
300
This is the median of the following data set:
14, 17, 4, 20, 10, 17
What is 15.5?
300
This is the MAD of the following data set:
4, 10, 12, 13, 14, 18, 20
What is 3.7
(mean is 13; distance from mean is: 9, 3, 1, 0, 1, 5, 7
26/7 = 3.7)
300
This is how you determine the median on a dot plot.
What is find the value of the middle dot on the dot plot?
300
What is Q1 of the data?
16
300
If most of the data is on the left, and it drops off to the right, it is said to be ...
Skewed Right
300
What state is surrounded by the most water?
Hawaii
400
Statistical or not statistical: How old are the paintings in the museum?
What is statistical (many paintings in a museum with a variety of ages)
400
This is the mode of the following data set:
78, 72, 81, 83, 67, 84, 81, 79, 78
What is 78 & 81
400
This is the MAD of the following data set:
2, 7, 7, 9, 10, 15, 20, 23
What is 5.8 (Mean = 11.6, difference from mean is: 9.6, 4.6, 4.6, 2.6, 1.6, 3.4, 8.4, 11.4; 46.2/8 = 5.8)
400
These are 4 requirements when creating a histogram.
What is title, labels, same size intervals, bars that touch (no spaces between the bars)
400
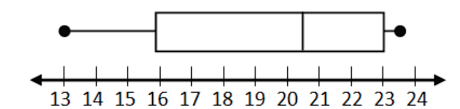
Make a box plot for the following data
16, 16, 16, 20, 21, 21, 23, 25, 26, 26, 28, 28
400
If most of the data is on the right, and drops off to the left, it is said to be ...
Skewed Left
400
David's father has three sons: Snap, Crackle, and ____!
David
500
Statistical or Not Statistical: How many students at East have Nike shoes?
What is not statistical? (counting, one answer)
500
This is the mean, median, & mode of the following data set: 70, 68, 56, 62, 56, 66, 56
What is Mean: 62, Median: 62, Mode: 56
500
These are the steps necessary to calculate the MAD of a data set.
What is Step 1: calculate the mean of the data set.
Step 2: calculate the difference between each number in the data set and the mean.
Step 3: calculate the mean of the differences (add up the differences and divide by the number of items in the data set)
500
True or false: the following intervals would be appropriate to use for a histogram: 0-4, 5-9, 10-14, 15-20, 30-34
What is false: 15-20 is bigger than the rest of the intervals (they all have to be the same size) and there should be no gaps (to correct: change 15-20 to 15-19 and add the intervals 20-24 & 25-29).
500
What is the IQR of the data?
7
500
Variability refers to how ________ out the data is.
spread
500
How many books can you put into an empty backpack?
1, after that it's not empty anymore!