A
B
C
D
E
100
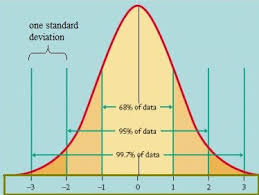
The average distance of observations from their mean
Standard Deviation
100
The average squared distance of the observations from their mean
Variance
100
Displays the counts or percents of categories in a categorical variable through differing heights of bars
Bargraph 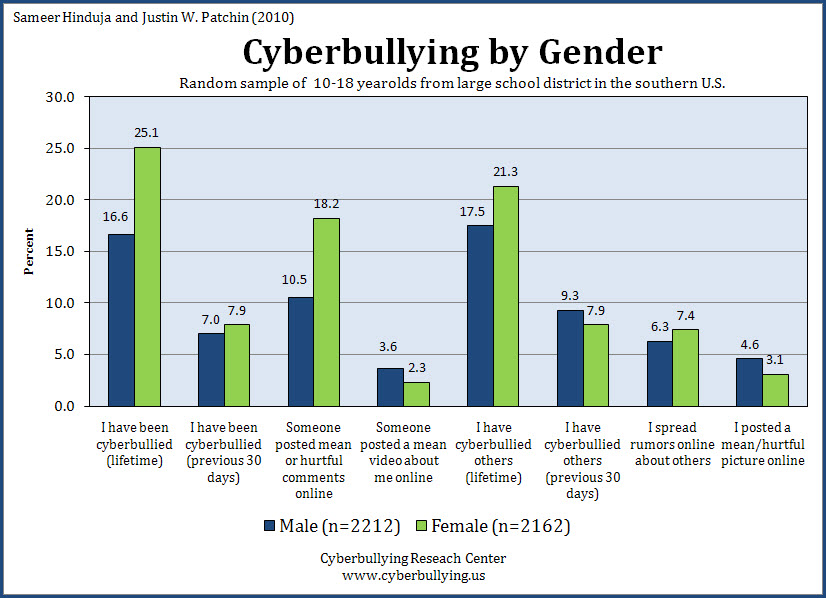
100
Tells you what values a variable takes and how often it takes these values
Distribution
100
Displays a categorical variable using slices sized by the counts or percents for the categories
Pie Chart
200
When specific values of one variable tend to occur in common with specific values of another
Association
200
A measure of center, also called the average
Mean
200
A graphical display of quantitative data that involves splitting the individual values into two components
Stemplot
200
One of the simplest graphs to construct when dealing with a small set of quantitative data
Dotplot

200
Drawing consclusions beyond the data at hand
Inference
300
The shape of a distribution if one side of the graph is much longer than the other
Skewed

300
What we call a meassure that is relatively unaffected by extreme observations
Resistant
300
The objects described by a set of data
Individuals
300
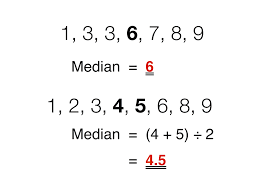
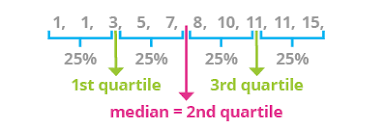
The midpoint of a distribution of quantitative data
Median
300
A ____________ distribution describes the distribution of values of a categorical variable among individuals who have a specific value of antother variable.
Conditional

400
A variable that places an individual into one of several groups of categories
Categorical
400
A characteristic of an individual that can take different values for different individuals
Variable
400
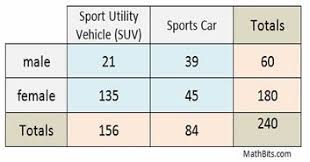
When comparing two categorical variables, we can organize data in a
Two-way table
400
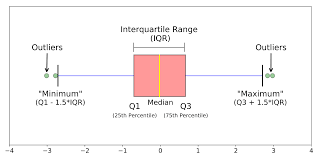
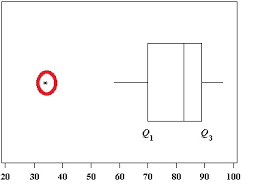
A graphical display of the five-number summary
Boxplot or Box and Whisker Plot
400
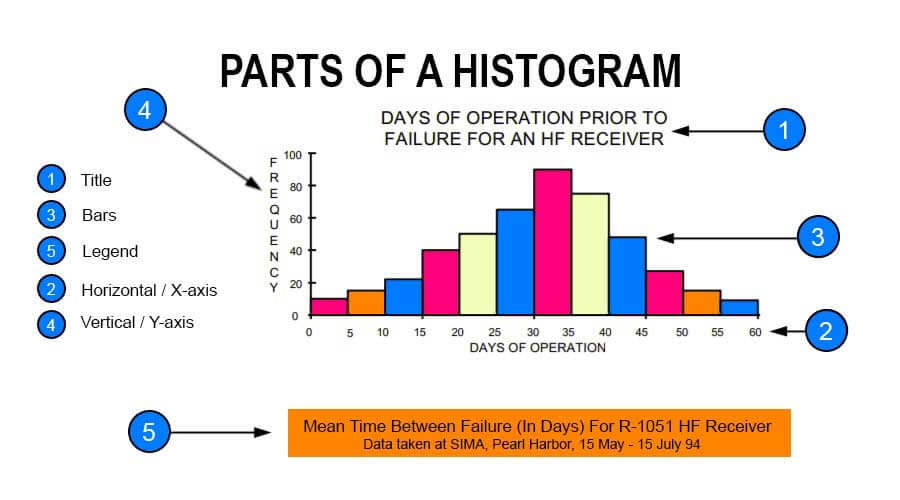
A graphical display of quantitative data that shows the frequency of values in intervals by using bars
Histogram
500
A variable that takes numerical values for which it makes sense to find an average
Quantitative
500
The shape of a distribution whose right and left sides are approximate mirror images of each other
Symmetric
500
These values lie one-quarter, one-half, and three-quarters of the way up the list of quantitative data.
Quartiles
500
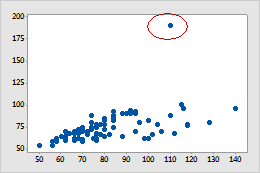
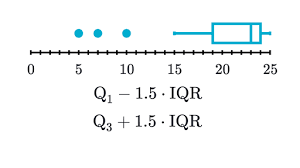
A value that is at least 1.5 IQRs above the third quartile or below the first quartile
Outlier
500
Important discriptors used when exploring data:
SOCS
Shape, Outliers, Center & Spread