Function to Data
Scatter Plot
Regression Equations
Best Fitting Model
Linear and Exponential Regression
100
What variables you need for plugging in a data set.
X and Y
100
Why is it called a scatter plot?
Because the different points in the data set are scattered.
100
What is a regression equation?
It shows a set of statistical processes for estimating the relationships between a dependent variable and one or more independent variables.
100
How do you know when to use each type of regression?
Analyze the graph, correlation coefficient or residual plot.
100
What are the different types of regression that we learned about?
Linear and Exponential
200
What is the slope intercept form equation?
y=mx+b
200
A scatter plot is a set of ______?
data points
200
How does removing an outlier effect your trend line?
It will make the trend line more accurate and better use for predictions.
200
What information is used to decide if data has a linear or exponential regression?
the correlation coefficient or the residual plot.
200
Which scatter plot shows no relationship?
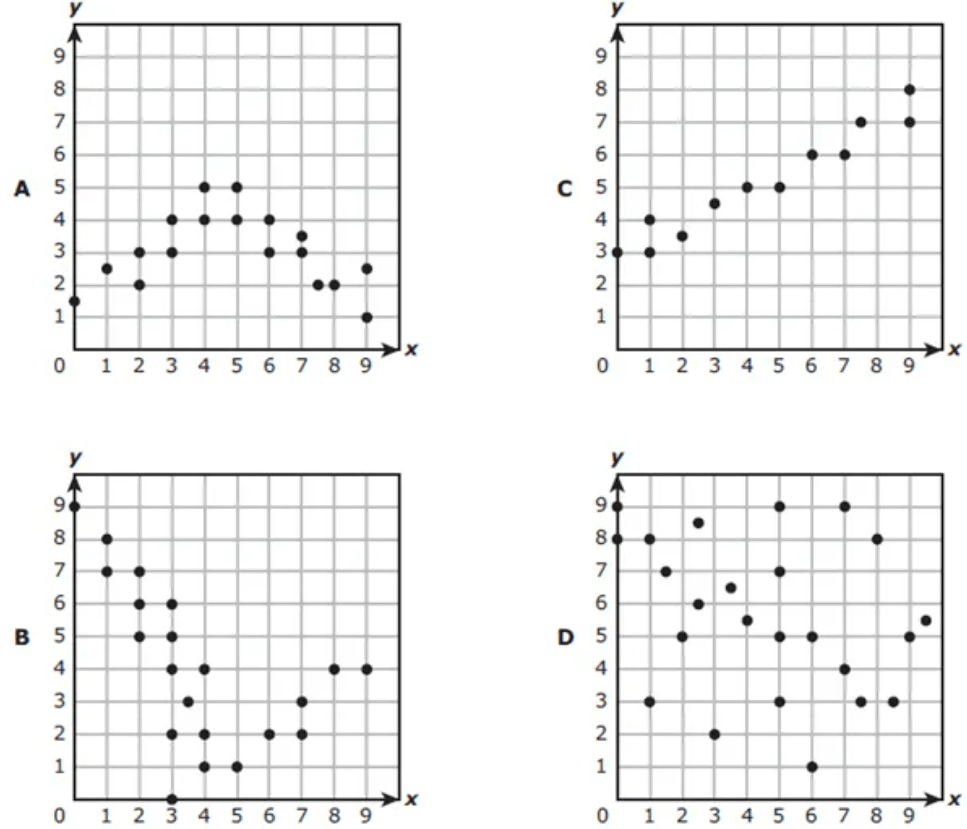
D
300
What is the line that best represents the middle of the scatter plot data?
The line of best fit or linear regression.
300
What is a scatter plot?
Graph where the values of two variables are plotted along two axes and the pattern of the resulting points revealing any correlation present.
300
How can you tell the difference between the regression equations?
Each equation is different and has a different setup of the variables present.
300
What is an example of a linear regression?
y=.75x+10
300
If my residual plot is a curved, what type of regression exists?
Exponential
400
How would you put a data set in the calculator?
Stat -> Edit -> Type in data in L1 (x-variable) and L2 (y-variable).
400
What is the difference between the positive, negative, and N/A correlations in scatter plots?
Positive is when the points are scattered closely together to the right.
Negative is closely scattered to the left.
N/A is when the points are randomly scattered throughout the graph.
400
What does r in the regression variable list mean?
It is the correlation coefficient and based on the the number describes the data set's correlations strength and type of trend (positive/negative)
400
The correlation coefficient is -.65. What does this describe?
Negative Moderate Correlation.
400
Describe the association of the scatter plot.
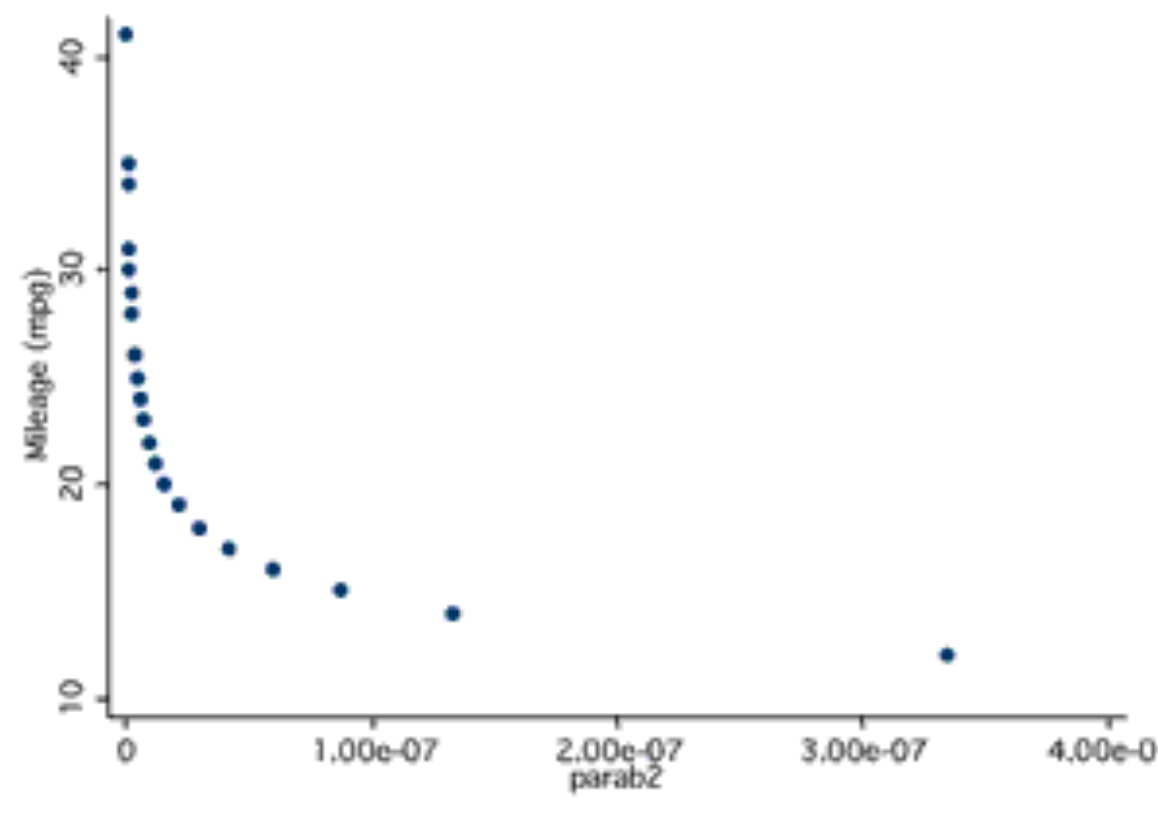
Exponential, Decay
Strong
500
What is an example of a data set that could be used for a scatter plot?
People weighing 100lbs - 200lbs (x-variable)
People being 50in - 75in (y-variable)
500
How does a scatter plot compare to a regular graph?
A scatter plot shows the relationship between the data while a regular graph shows the trend of the data.
500
Once the data is in L1 and L2, how would you make the line of best fit for the scatter plot in the calculator?
You would plug in the regression equation into the "y=" button and press 2nd -> table and plug whatever number you are trying to solve for in for "x."
500
How could this be used in real life?
Companies could use data like this to estimate future revenue.
500
If my residual plot is random, what type of regression exists?
Linear Regression