Terms and Definitions
Frequency Tables and Histograms
Pareto Charts/Stem&Leaf
Circle Graphs
Misc.
100
Is the Variable Qualitative or Quantitative?
Weight (in pounds)
Quant
100
How many students received an A or a B on the exam?

8
100
Is the following graph a Pareto chart?

No
100
All the percentages in a circle graph should total to about __________, and the degrees to _____________
100; 360
100
Identify the skew of the Distribution

right skew
200
During the 2006 NFL postseason play, the 12 participating teams scored the following numbers of passing touchdowns: {0,0,1,1,1,2,2,3,3,3,3,5}
What is the variable in this study?
The number of passing touchdowns scored by the 12 participating teams
200
Histograms are only used for what kind of data?
Quantitative
200
What is an advantage that bar graphs have that histograms do not?
You can graph qualitative (categorical) data
200
Students were asked to pick common reasons they were late to school (they were allowed to pick more than one). The percentage of students who put a check next to a particular response is recorded below. What is the best graph for representing this data?
Woke up late: 56%
Lost track of time: 22%
Car Troubles: 13%
Late Night Studying: 45%
Dropped sibling off first: 10%
Pareto chart; I will accept bar graph
Can't be a circle graph
200
Is this a proper bar graph?
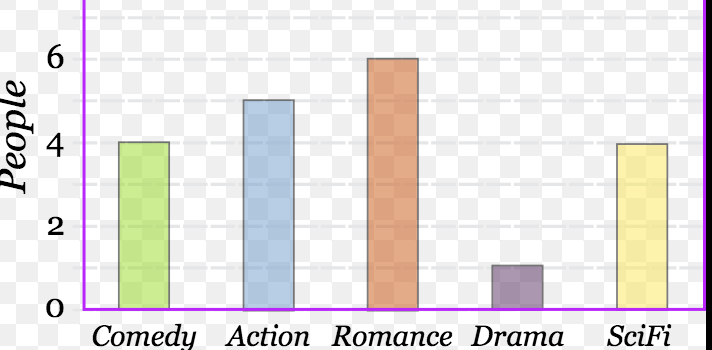
No, it does not have a title
300
Classify the following as nominal, ordinal, interval, or ratio:
The time of day
The time it takes me to get to school
interval
ratio
300
Calculate the class width for the following data, for

10
300
Below is a distribution of test scores. How many people received a grade higher than 91.0?

2
300
What percent of families surveyed below own cats?

32%
300
A test that was extremely easy is likely to have what kind of skew?
left skew
400
A company wishes to survey what people think about a new product it plans to market. They decide to randomly sample from their customer database as this includes phone numbers and addresses.
What is the implied population?
The company's customer database
THE SAMPLE COMES FROM THE POPULATION
400
Why does one always have to round up when calculating class width?
The largest value may not be accounted for in the class limits
400
Which age appears most often in this data set?
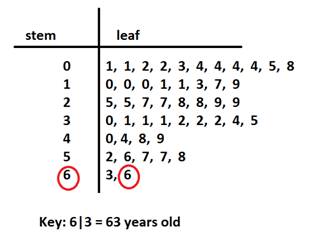
4
400
"Other Products" Should be shaded how many degrees on a circle graph?

54
400
COVID infection rates started slowly in March, began steadily increasing, and peak in early June. Afterwards, they steadily decreased for a while, but began increasing again in October to people in early December. They then began steadily decreasing.
The kind of skew (data distribution) I have described above is
*It's not that hard.
bimodal
500
I want to calculate the average time high school students at IFS spend doing homework on weekends. I ask every high schooler the question and calculate the average to be 2.5 hours.
What is the sample statistic I have given in this scenario?
None; it's a population parameter. I asked everyone, hence it is not a sample
500
What is the relative frequency that a speed will fall between 80-89 mph?
.08
500
True/False: 90 is a value on this data set

False
500
How many degrees are shaded in for "sleeping"? 
144
500
Name 2 types of graphs that can represent categorical data
Named 2 others that are only used to represent quantitative data
Bar and Circle Graphs
Histograms, Stem and Leaf