Definitions
Types of Data
Graphs
Excel
Distributions
100
A survey to collect data on the entire population
What is: Census
100
When the data for a variable consist of labels or names used to identify an attribute of the element, the scale of measurement
What is a Nominal scale
100
Series of data points connected by a straight line segments 
What is Line Graph
100
All excel formulas begin with...
What is an equal sign
100
Bell-shaped distribution determined by its mean and standard deviation
What is normal distribution
200
A graphical display of the relationship between two quantitative variables. One variable is shown on the horizontal axis and the other variable is shown on the vertical axis.
What is: Scatter diagram
200
Data collected at the same or approximately the same point in time
What is Cross-sectional data
200
Graph divided into slices to illustrate proportion
What is a Pie Chart
200
How do you find the mean of a range of cells?
 What is =AVERAGE?
200
Often used with categorical variables, it is an overview of all distinct values in some variables and the number of times they occur.
What is a frequency distribution
300
Events that have no sample points in common; that is, A ∩ B is empty and P(A ∩ B) = 0.
What is: Mutually exclusive events
300
Data collected over several time periods
What is Time series data
300

What is a Histogram
300
How do you find the the largest and smallest value in the range?

 What is =MAX and =MIN?
300
This distribution shows the probability that a certain event will occur when there are two independent random variables.
What is a bivariate distribution
400
A continuous probability distribution that is useful in computing probabilities for the time it takes to complete a task
What is: Exponential probability distribution
400
Data that use numeric values to indicate how much or how many
What is quantitative data
400
Graphically depicting groups of numerical data through quartiles
What is Box and Whisker Plot
400
What is the difference between STDEV.S and STDEV.P?
STDEV.S calculates standard deviation of a sample; STDEV.P calculates the standard deviation of a population.
400
This distribution shows the probability of x successes in n trials of a binomial experiment.
What is binomial distribution
500
A random variable that may assume any numerical value in an interval or collection of intervals.
What is: Continuous random variable
500
Data that can be grouped by specific categories
What is Categorical data
500
Method for showing the frequency with which classes of values occur
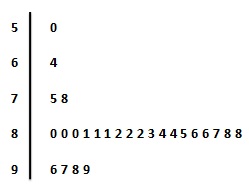
What is Stem and Leaf Plot
500
A(n) ____ cell reference does not change when the formula is copied or moved.
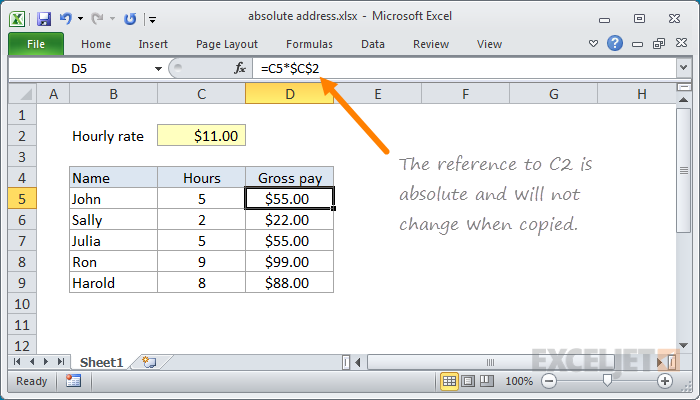 What is absolute? Bonus Points for: what is $A1, A$1, $A$1?
500
The distribution of a sum of the squares of k independent standard normal random variables.
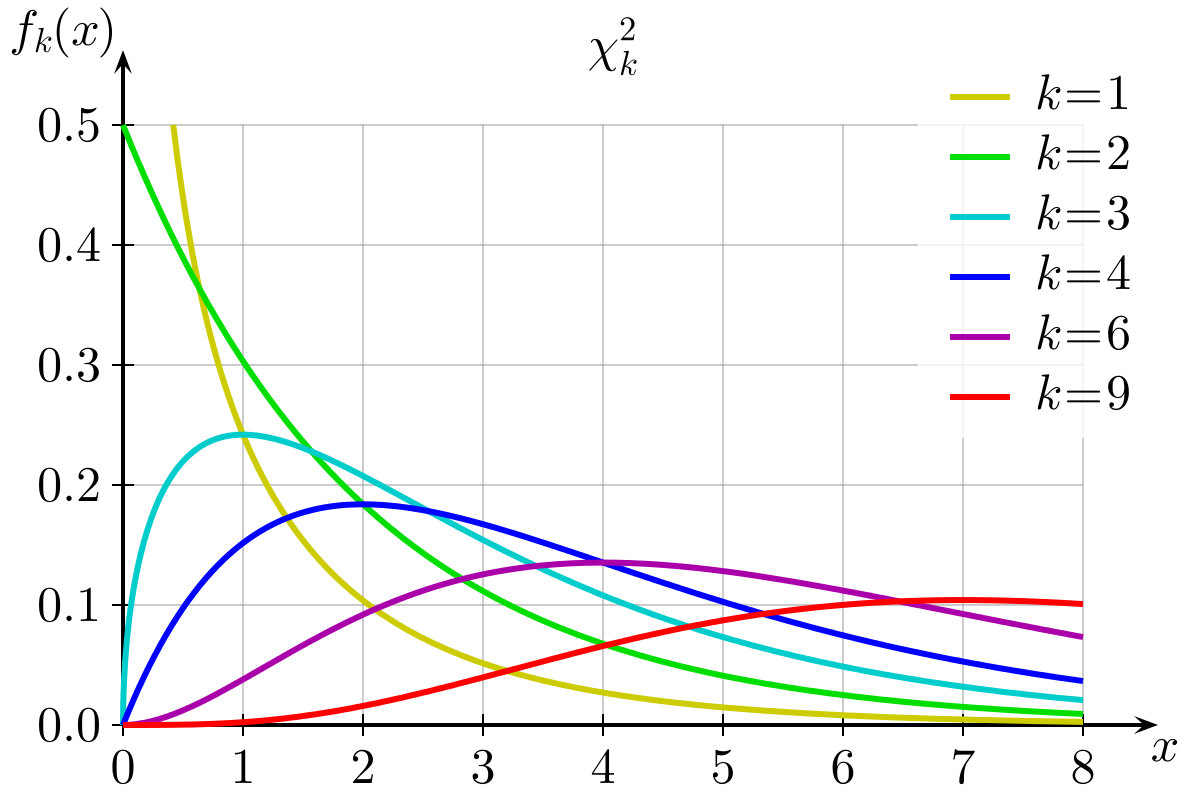
What is Chi-Square distribution