Hysterical Histograms
Thinking Outside the Box-plot
Spurious Correlations
"I'm Confused" Matrix
Dido and the Empirical Rule
1
This histogram is ____ skewed.

What is right?
1

This fruit has the smallest Interquartile Range.
What are peaches?
1

This plot has a ______ correlation. (Strong/weak and positive/negative)
What is strongish negative?
1
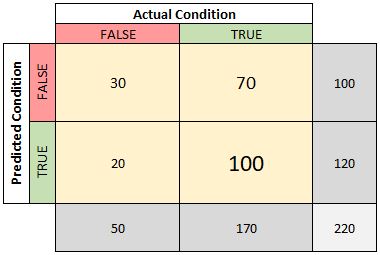
This data set has this many total participants.
What is 220?
1
Dido is in charge of telling her farmers when to plant their crops. She knows that the temperature cannot be too hot or too cold on a crop planting day.
Spring temperatures in Carthage had a mean of 70 degrees Fahrenheit with a standard deviation of 7.
What percentage of days have a temperature between 63 and 77?
What is 68 percent?
1
This histogram is ____ skewed.
What is not? or What is symmetric?
1
This fruit has an outlier at about 60g.
What are oranges?
1
An R value of .267 indicates a _______ correlation.
(Weak/strong and positive/negative)
What is weak positive?
1
This is the probability that a person received a false negative test.
What is 70/220?
1
Spring temperatures in Carthage had a mean of 70 degrees Fahrenheit with a standard deviation of 7.
What percentage of days have a temperature between 56 and 84?
What is 95%?
1
In this histogram, the mean is ____ than the median.
What is less?
1
This fruit has the highest median mass.
What are peaches?
1
An R value of -.91 indicates a ______ correlation.
What is strong negative?
1
This is a the probability that a person received a false positive test.
What is 20/220?
1
Spring temperatures in Carthage had a mean of 70 degrees Fahrenheit with a standard deviation of 7.
What percentage of days have a temperature between 49 and 91?
What is 99.7%?
1
In this histogram, the mean is ____ than the median.
What is greater?
1
I have a fruit on my scale that weighs 170g. It must be a _____.
What is a tomato?
1
The equation of my line of best fit is
y = .5x + 6.
If my measured indicator variable is 10, what is the predicted value?
What is 11?
1
This is the probability that a person who does not have the condition tests negative.
What is 30/50?
1
Spring temperatures in Carthage had a mean of 70 degrees Fahrenheit with a standard deviation of 7.
A high temperature of 56 is too cold. What percentage of days had a high temperature higher than 56?
What is 97.5%?
1
This histogram is ____ skewed.
What is left?
1
Name one of the four books that are parodied in the Spidel bathrooms.
What are Sherlock Holmes, A Tale of Two Cities, Are You There God? It's Me Margaret, and Treasure Island?
1
This scatter plot indicates a ______ correlation.
What is strong positive?
1
This is the probability that a person who tests negative actually has the condition.
What is 70/100?
1
Spring temperatures in Carthage had a mean of 70 degrees Fahrenheit with a standard deviation of 7.
Farmers will complain a lot if they have to plant on a day higher than 77, and 56 is too cold for the crops. What percentage of days fall between 77 and 56?
What is 81.5%?