Graphs
Type of Data
5 number summary
Situations
Reading a graph
100
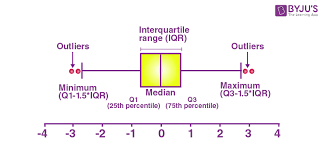
Box and Whisker Plt
100
Categorical or Quantitative
What is your favorite color?
Categorical
100
What is the min and max?
2, 6, 8, 9, 10
Min: 2
Max: 10
100
You are taking data on what classes freshman students are taking at SFCC. You ask 100 students in the parking lot at 8am
What is the population?
Freshman SFCC students
100
How many people were asked?

20
200

Bar Graph
200
Categorical or Quantitative
How old are you?
Quantitative
200
What is the range?
1, 4, 7, 9, 12
12-1 = 11
200
You are taking data on what classes freshman students are taking at SFCC. You ask 100 students in the parking lot at 8am
What type of sampling method is this?
Convenience sampling
200
What is the mode?
50-60
300
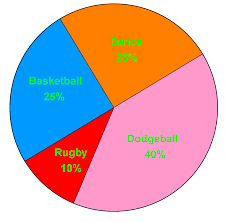
Circle Graph
300
Categorical or Quantitative
How many hour do you watch netflix?
Quantitative
300
What is the median:
1, 3, 5, 7, 9, 11, 13, 15, 17
9
300
You are taking data on what classes freshman students are taking at SFCC. You ask 100 students in the parking lot at 8am
Is there a bias in this method? Is so, what?
Yes, you are only asking students in the parking lot at 8am
300
How many people are 50 or older?
10
400
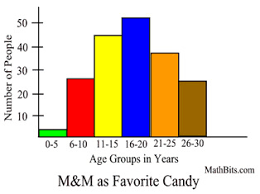
Histogram
400
Categorical or Quantitative
On a scale of 1 to 5, how is your day going?
Quantitative
400
What is the median?
2, 4, 6, 8, 10, 12, 14, 16
8 and 10
8+10= 18
18/2 = 9
400
You are taking data on what classes freshman students are taking at SFCC. You ask 100 students in the parking lot at 8am
Categorical or Quantitative?
Categorical
400
How many people are younger than 40?
6
500
What is a graph you would use to show Categorical data?
Bar graph
Circle graph
500
Categorical or Quantitative
What classroom is your math class in?
Categorical
500
What is the 5 number sumary?
1, 2, 3, 3, 4, 4, 7, 9, 14
Min: 1
Q1: 3
Med: 4
Q3: 7
Max: 14
500
You are taking data on what classes freshman students are taking at SFCC. You ask 100 students in the parking lot at 8am
How would you change this study to make it more accurate?
Ex:
500
What percentage of people are 70 or older?
2/20 = .1 = 10%