Empirical Rule
Standard Deviation
Stem Leaf/Dot Plots
Bar Graph, Histogram and Box/Whiskers
Normal Distribution
100
What is another name for the empirical rule?
It's also known as the 68-95-99.7% rule
100
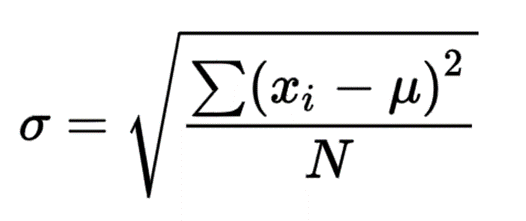
What do ,
, ,
,  and
and represent?
=standard deviation
=the size of the population or sample size=each individual value or score
=mean
100
A stem and leaf plot is a visual way to present _______ type of data
Quantitative (data)
100
Histograms are used for __________ data and Bar graphs are used for _________ data
Quantitative data for Histograms and Categorical data for Bar graphs
100
Draw a Normal distribution, skewed to the Left and skewed to the right graph. Make sure you label which one is which.

200
What does the empirical rule state?
68% of the data falls within 1 S.D above/below the mean
95% falls within 2 S.D.'s of the mean
99.7% falls within 3 S.D.'s of the mean
200
Write an informal or formal definition of Standard Deviation
S.D. measures how spread out or dispersed the data is from the mean
S.D. measure how reliable the mean represents the data
200
How many people on this stem and leaf plot are between the ages of 10 and 30
17 people are between the ages of 10 to 30
200
Find the mean, median, mode and range?
100,125,150,175,125,175,200
Mean= 150
Median=150
Mode= 125 and 175
Range= 100
200
What are some key differences between Skewed to the Left and Skewed to the right graphs? Need at least two for each.
Skewed to the Left
Tail extends to the left (lower values).
Most data is clustered on the right (higher values).
Mean < Median (mean is pulled down by low values).
Skewed to the Right
Tail extends to the right
Most data is clustered on the left (lower values)
Mean > Median (mean is pulled up by large values)
300

What percent of students scored below a 14?
16% of students scored below a 14
300
What are the two pairs of measurements for center and spread, when choosing how to represent data?
1. Median and IQR
or
2. Mean and Standard Deviation
300

What is the slope and what does the slope represent/mean in this context?
Slope is 3/2 and it represents an increase of 3 degrees F every 2 hours
300
Find min, max, Q1, Q2 and Q3
123 67 43 54 76 90 72
Min: 43
Max: 123
Q1: 54
Q2 (Median): 72
Q3: 90
300
What are some Normal Distribution properties? Name at least 3
The graph is symmetrical
The mean and median are equal
It's bell shaped
It uses the empirical rule (68-95-99.7 rule)
It utilizes the mean and standard deviation
400
What percent of students scored between 22 and 30?
15.85% of students scored between 22 and 30
400
What can significantly alter the standard deviation of a data set?
Having outliers or extreme values compared to the rest of the data
400

How many runners ran an even amount of kilometers that are less than 14 and more than 8 kilometers?
10 runners
400
|-----------[_______][___]----|
38 72 88 96 102
Given the box and whiskers plot above, what percent of the class scored between 88 & 96? Whats the IQR?
25% scored between 88/96
IQR=96-72=24
400
Draw a normal distribution graph representing quiz scores in points with a
=4 and a =18 that includes 3 S.D.'s above and below the mean

500
The population of CVLCC Cobras students and staff is normally distributed with a mean of 5'6 and a standard deviation of 3 inches. Mr.Luis is considered tall at 6'0. What percent of students/staff are shorter than Mr. Luis?
Around 97.5% of students/staff are shorter than Mr.Luis @CVLCC HS
500
Calculate the mean and standard deviation for the following teachers ages
27, 30, 30, 39, 39, 35, 44
Round your all your work/answers to 2 decimals.
=34.86
=6.15
500
In the film Avengers Infinity War, how many possible outcomes of the conflict with Thanos did Dr. Strange see?
Strange saw 14,000,605 possibilities
500

The exams above are scores for a Calc BC final exam at UCR. Anything below a 60 is a failing grade and walk of shame. What percent of the total students passed the final? Round your answer to one decimal.
240/420= 57.1%
500
In his last Vibranium Engineering class at UCR, Mr. Luis scored a 58 on his final. His friend Steve Rogers scored a 94. The class average was a 67 with a standard deviation of 9. State with detail how many S.D.'s around the mean did Mr.Luis and Rogers score?
Mr. Luis scored 1 Standard deviations below the mean and Rogers scored 3 standard deviations above the mean.