Measures of Central Tendency
Basic Probability
Z-scores
Tables and Venn Diagrams
Grab Bag
100
For the dataset {3, 7, 8, 12, 15}, what is the mean?
9
100
The probability of rolling a sum of 7 when rolling two fair six-sided dice.
1/6
100
If a population has mean = 100 and standard deviation = 15, this is the Z-score for an observation of X = 130.
2
100
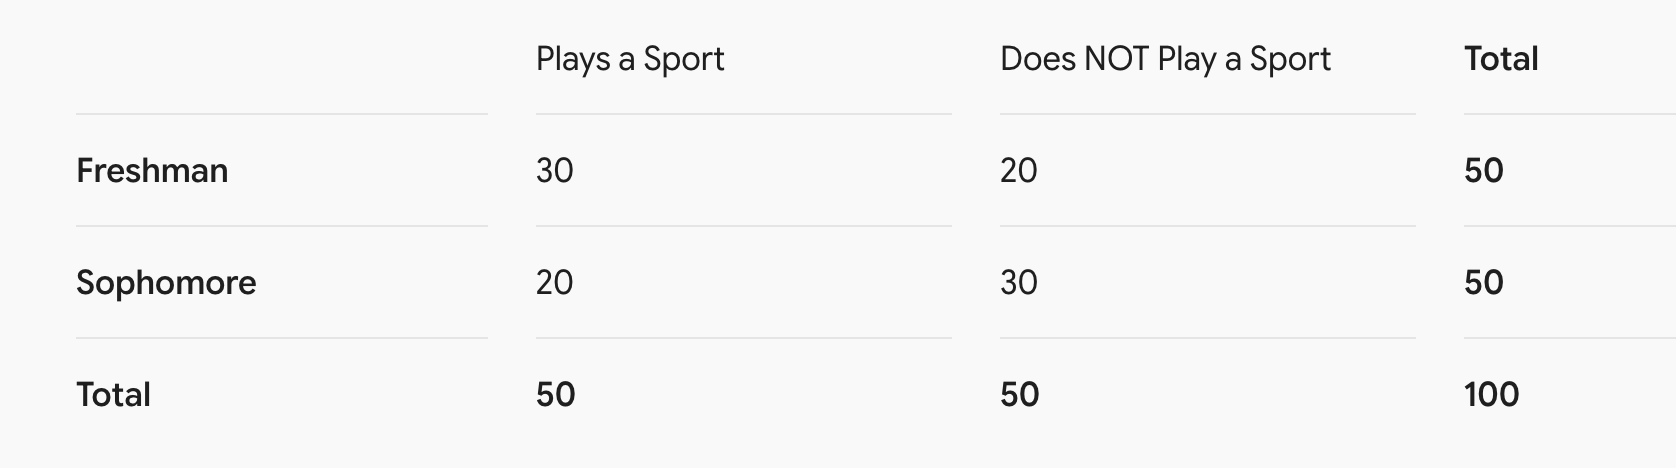
Based on the table, this is the simple probability of selecting a student at random who is a Freshman.
1/2
100
For the sample dataset {2, 4, 10}, this is the range.
8
200
For the dataset {12, 5, 22, 18, 9, 14}, what is the median.
13
200
A bag contains 4 red and 6 blue marbles. If two marbles are drawn without replacement, this is the probability that both are red.
2/15
200
A normal distribution has mean = 70 and standard deviation = 5. According to the Empirical Rule (drawing a Bell Curve), approximately 68% of the data falls within this numerical range. Give me the numbers
65 to 75
200
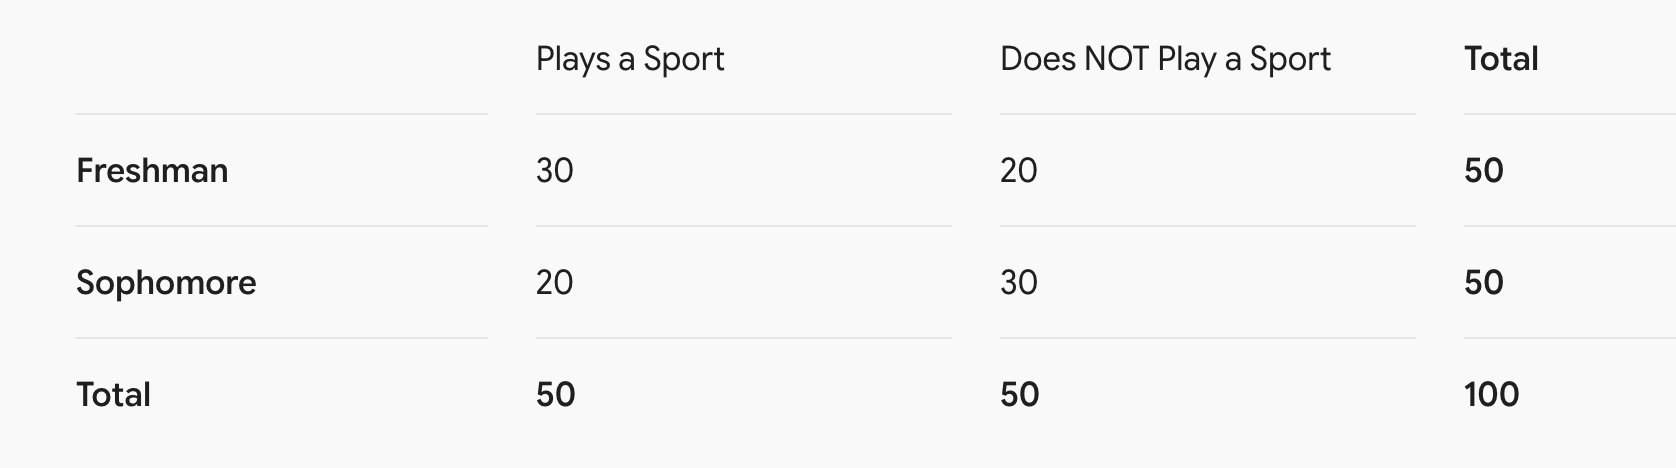
This is the probability of selecting a student at random who is a Sophomore AND plays a sport.
1/5
200
For the sample values {2, 4, 6}, this is the standard deviation.
2
300
If a student scores 80, 85, and 90 on three tests, they need this score on the fourth test to average an 88.
97
300
The probability of picking a queen or a king from a standard 52-card deck.
2/13
300
In any normal distribution, this percentage of values falls below the mean.
50
300
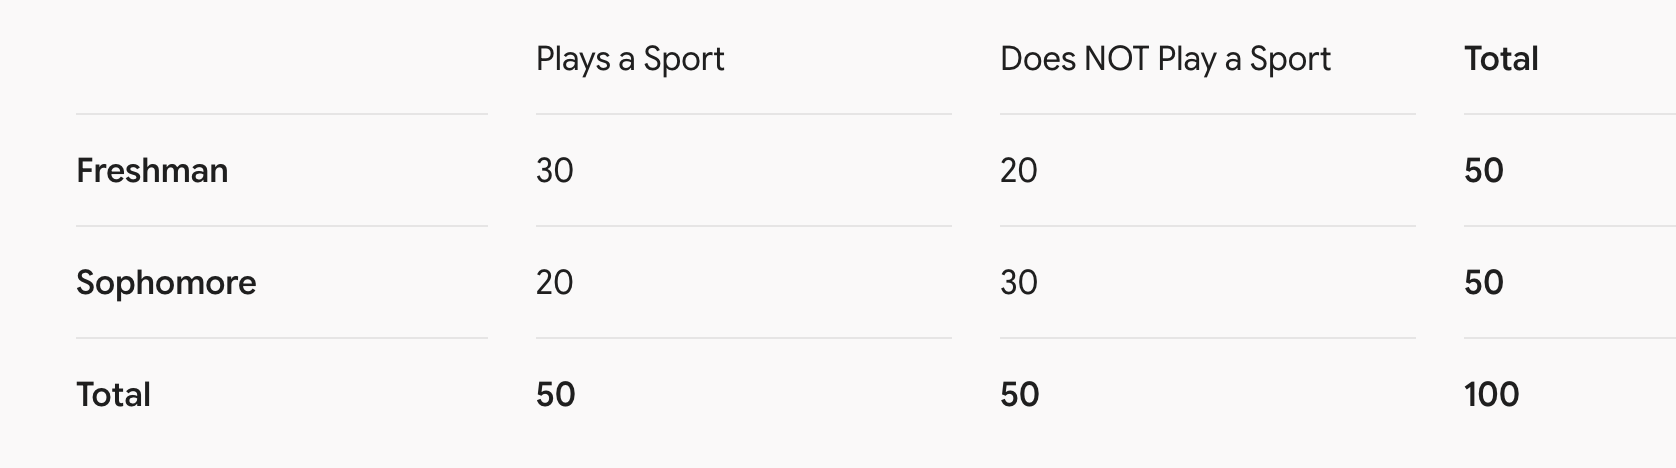
Given that a randomly selected student is a Freshman, this is the conditional probability that they play a sport.
3/5
300
The probability of an event A occurring is 0.15. This is the probability that event A does NOT occur.
.85
400
A course grade uses Homework (20%), Midterm (30%), and Final Exam (50%). If a student scores 90 on Homework, 70 on the Midterm, and 80 on the Final, this is their weighted mean score.
79
400
If a jar has 5 green, 3 yellow, and 2 blue marbles, this is the probability of randomly choosing a marble that is NOT yellow.
7/10
400
On a test with a mean = 80 and standard deviation = 5, a student with a Z-score of +2.0 received this exact score.
90
400
A group of 100 high school students were surveyed about taking Math and Science courses:
60 take Math
50 take Science
30 take BOTH Math and Science
Based on the scenario, this is the number of students who take Math ONLY.
30
400

0.12
500
A dataset of 9 values has a mean of 20. When a 10th value is added, the new mean becomes 23. This is the value of the 10th number.
50
500
The probability of flipping a coin 3 times and getting tails on all 3 flips.
1/8
500
On a test with mean = 50 and standard deviation = 5, this percentage of scores falls between 40 and 60.
95
500
A group of 100 high school students were surveyed about taking Math and Science courses:
60 take Math
50 take Science
30 take BOTH Math and Science
What is the number of students that take neither?
20
500
Given Q1 = 15 and Q3 = 35, any data value strictly greater than this upper threshold is considered an outlier by the 1.5 times IQR rule.
65