Variable Types & Graph Selection
Describing Relationships & Scatterplots
Correlation, r and r^2
Regression, Prediction & Residuals
Outliers, Influential Points & Model Choice
100
This type of variable is used to predict or explain changes in another variable.
What is an explanatory variable?
100
In Question 8, the scatterplot showing bass weight vs. length displays this direction of association.
What is a positive relationship?
100
If r = –0.60, as in Question 48, this percent of variation in y is explained by x.
What is 36%?
100
A positive residual means the actual value is ________ the predicted value.
What is above? (Model underestimates.)
100
A point far in the x-direction with strong pull on the regression line is called this.
What is a high-leverage point?
200
In Question 2 (page showing energy consumption percentages), this is the most appropriate graph for displaying parts of a whole.
What is a segmented bar graph?
200
In Question 11, hours of safety training vs. workplace injuries shows this kind of linear association.
What is a strong negative linear relationship?
200
Switching explanatory and response variables keeps r identical. This property is because correlation is…
What is unitless (and symmetric)?
200
The relationship between the distance traveled (in kilometers) and the time spent traveling (in minutes) for a delivery service is modeled by the equation:

A positive residual of 3 minutes indicates the model does this.
What is underestimates the travel time?
200
In Question 136, Point A is described as both a vertical outlier and this type of point that strongly affects the line.
What is an influential point?
300
In Question 69, comparing page view distributions for summer and fall requires this type of graph.
What is a segmented bar graph?
300
In Question 12, precipitation vs. crop yield shows this specific shape.
What is a moderately strong positive nonlinear relationship?
300
In Question 109, altitude vs. temperature yields r = –0.69. This describes the strength and direction.
What is moderately strong and negative?
300
In Question 74, predicting revenue 30 years into the future is unreliable because it is an example of this.
What is extrapolation?
300
In Question 139, adding (4000, 21) changes the y-intercept this way.
What is decreases?
400
In Question 15, sport (soccer/track/baseball) vs. whether athletes completed preseason training should be displayed using this type of graph.
What is a segmented bar chart?
400
In Question 184, the scatterplot of houses sold vs. months since Jan 2023 demonstrates this model type is inappropriate due to curvature.
What is a linear model? (It is inappropriate.)
400
In Question 142, adding the point (85, 86) has this effect on correlation.
What is making the correlation stronger (closer to +1)?
400
In Question 127, the model is appropriate because of this characteristic shown in the residual plot.
What is random scatter?
400
In Question 148, the model is rejected because this required point is not on the regression line.
What is the point (x̄, ȳ)?
500
In Question 68, the distribution of AP courses for teachers is skewed with an outlier. This is the better measure of variability.
What is the IQR?
500
In Questions 197–200, the scatterplots demonstrate that a strong correlation does NOT guarantee this important condition for linear modeling.
What is linearity? (A strong r does not imply a linear model is appropriate.)
500
In Question 199, the better model is chosen because it has the stronger r² and this additional justification based on its residual plot.
What is that the residuals show random scatter?
500
The scatterplot in Question 64 displays actual home values and the fitted regression line:
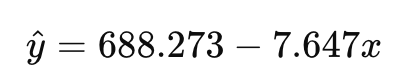
A particular home has been on the market for 33 days and has an actual value of $470,600.
Based on the scatterplot and the regression model, which of the following statements must be true?
A) The regression model overestimates the value for the home at 33 days.
B) The regression model underestimates the value for the home at 33 days.
C) The residual for this home is negative.
D) The predicted value for 33 days is more than $500,000.
E) The day with the lowest predicted value also has the lowest actual value.
What is B?
500
In Questions 164–166, the correct transformation is chosen because it produces this pattern in the residual plot.
What is a random (patternless) scatter?