Graphing:
Substitution
Elimination
Linear Inequalities
Vocabulary
100
y = 2x + 2
y = x − 1
(-3, -4)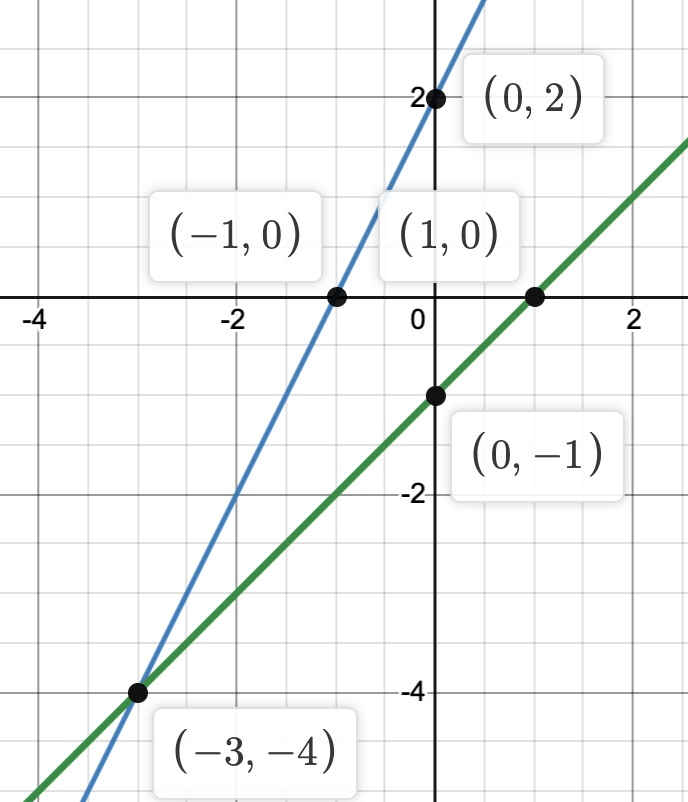
100
y = 2
3x + 2y = 10
(2, 2)
100
x + 3y = 5
2x − 3y = −8
(−1, 2)
100
What does a dotted line mean when graphing linear inequalities?
> or <
100
Consists of two or more linear equations
System of linear equations (linear system)
200
y = 2x + 4
y = 2x + 2
no solution
200
x = −3y + 2
−x + 2y = 3
(−1, 1)
200
−5y + 8x = −18
5y + 2x = 58
(4, 10)
200
How is graphing systems of inequalities different than graphing systems of equations? In other words, how do you graph a system of inequalities? (2 things)
Sometimes they use dotted lines and you have to shade for inequalities.
200
The method of solving equations where you add or subtract equations to end up with one variable.
Elimination or Addition Method
300
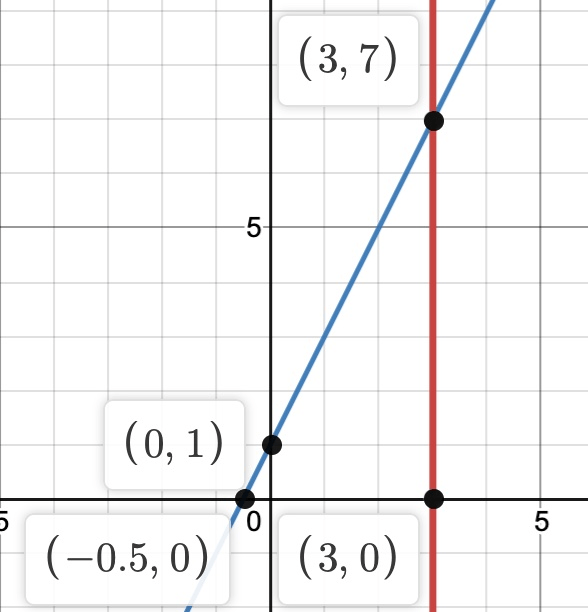
x = 3
y = 2x + 1
(3, 7)
300
x − 2y = −10
3x = y
(2, 6)
300
3y − 5x = −26
−2y − 5x = −16
(4, −2)
300
Where are the solutions when solving systems of inequalities with these symbols: < or >?
The solutions are where the shaded regions overlap.
300
How can you tell if a linear system has infinitely many solutions?
The equations are the same, the graphed lines lie on top of one another, or solving the system provides a true statement with no variables.
400
4x + 2y = 8
2x + y = 4
Every point on 2x+y=4 is a solution.
400
2x – 3y = –2
y = −4x + 24
(5, 4)
400
3x − 4y = 8
18x − 5y = 10
(0, -2)
400
y ≤ x − 2
y > −3x + 5
Shaded below the first line and to the right of the second line.
400
When will a system of linear inequalities have no solution?
The inequalities are parallel meaning they have the same slope but different y-intercepts and shaded away from each other. Meaning, the shading doesn't overlap
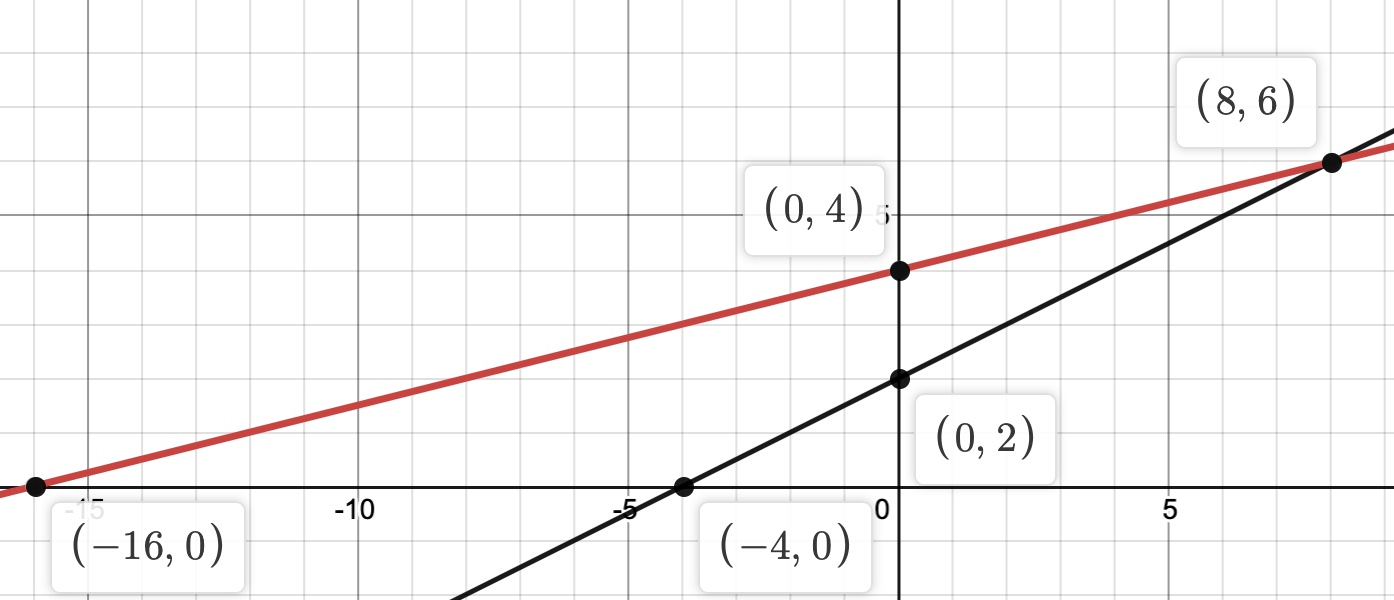
500
y = 1/2 x + 2
y = 1/4 x + 4
(8, 6)
500
5x − 13 = y
−5x + y = 24
no solution
500
4x−9y = 2
12x−5y = −38
(-4, -2)
500
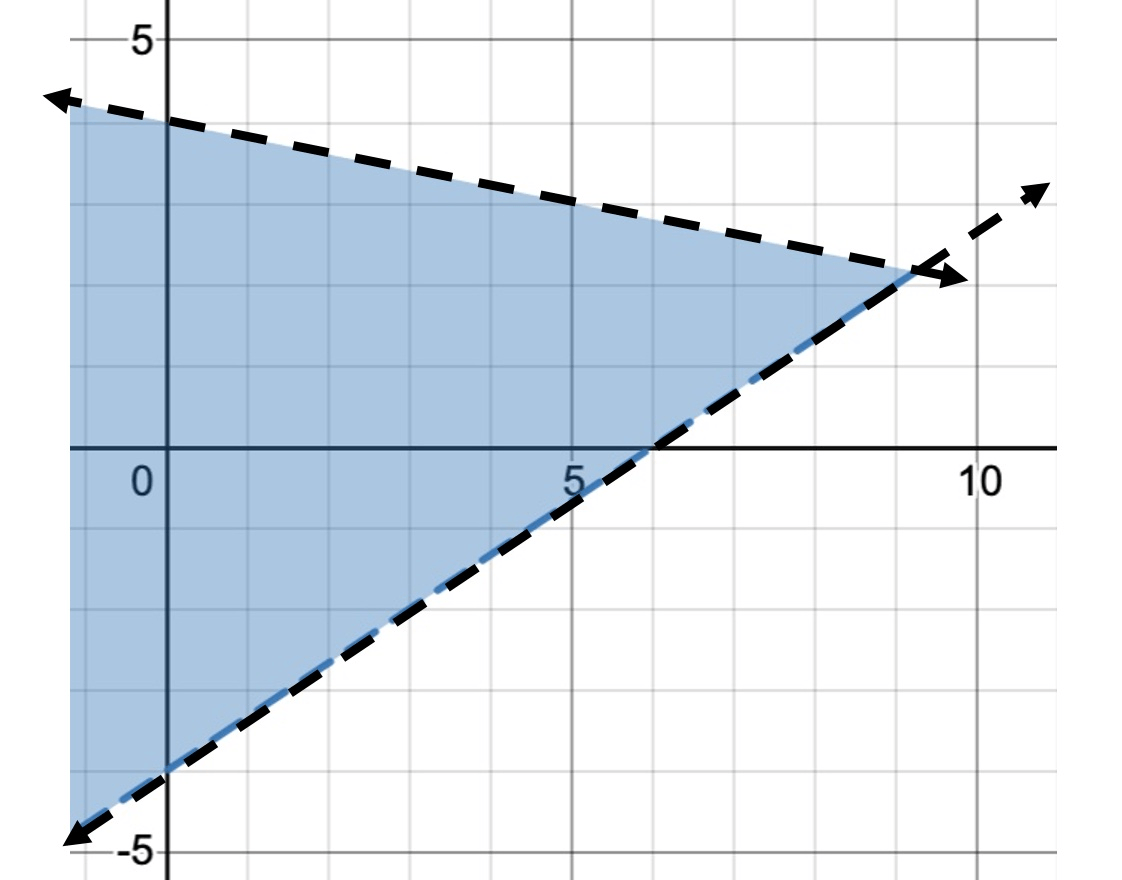
2x – 3y < 12
x + 5y < 20
Shade above the first line and below the second line.
500
Where is the solution if the two linear equations have different slopes?
The solution is the point of intersection.