Reading Picture Graphs
Bar Graphs
Review
100
What does each basketball count for?
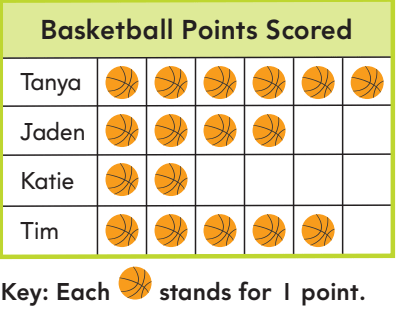
1 Point
100
Which bar shows the vegetable chosen by the most classmates?
A) The shortest
B) The tallest

The tallest
100
A ________ uses bars to show information.
A Bar Graph.
200
How many points did Tonya score?

6 Points
200
How many classmates chose peas or carrots?
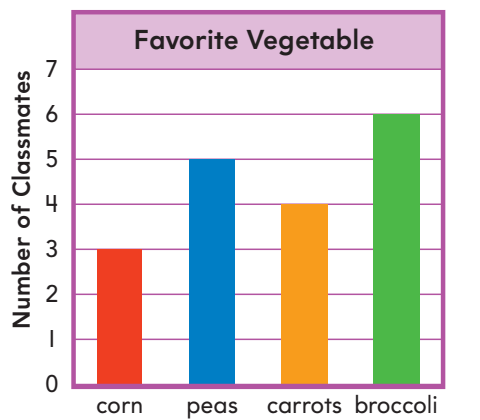
9 Classmates
200
In a picture graph, a __________ tells how many each picture stands for.
A key.
300
How many children chose soccer OR baseball?
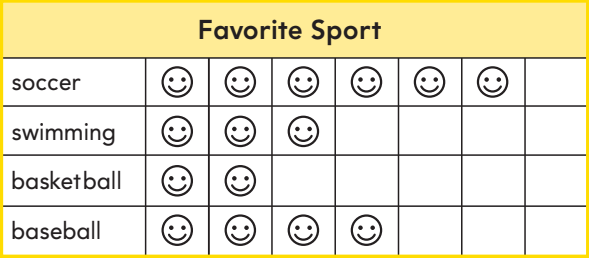
10 Children
300
How many fewer classmates chose corn than broccoli?

3 Classmates
300
Which bicycle colors were chosen by more than 6 children? Choose the two correct answers.
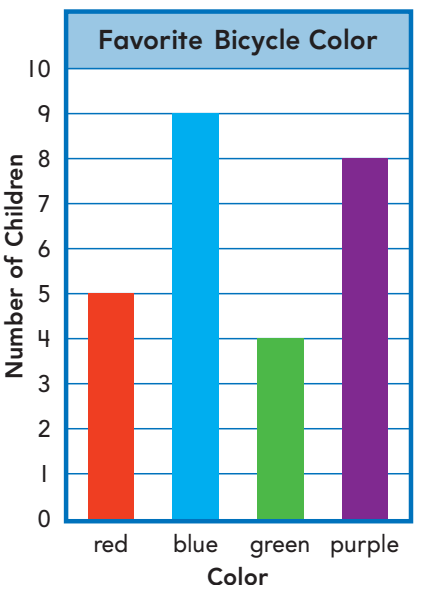
Blue and Purple.
400
How many points in all did Jaden and Katie score?
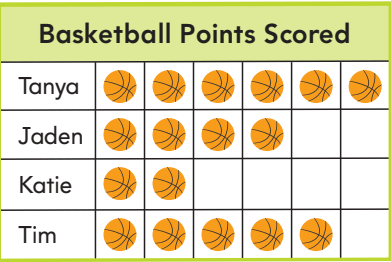
6 Points
400
How many fewer goals did Rob score than Isaac?
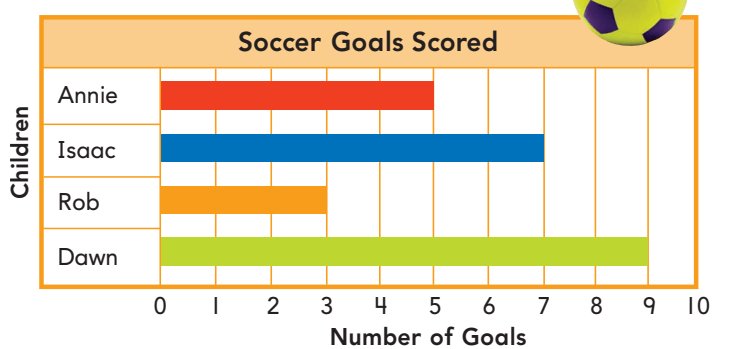
4 goals
400
If each tally mark stands for 1 book, how many tally marks will we draw to show the books sold on Thursday?
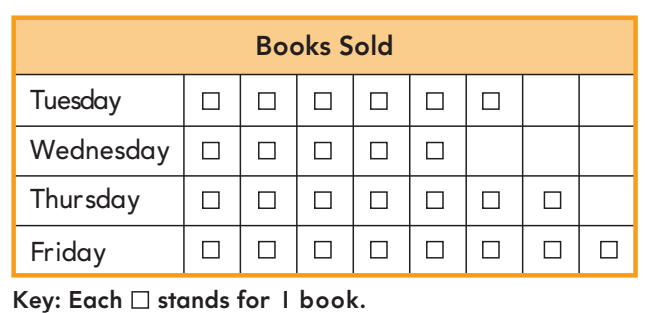
7
500
How many more points did Tanya score than Katie?

4 more points.
500
Two children change their favorite smoothie from banana to orange. Now how many children choose orange?
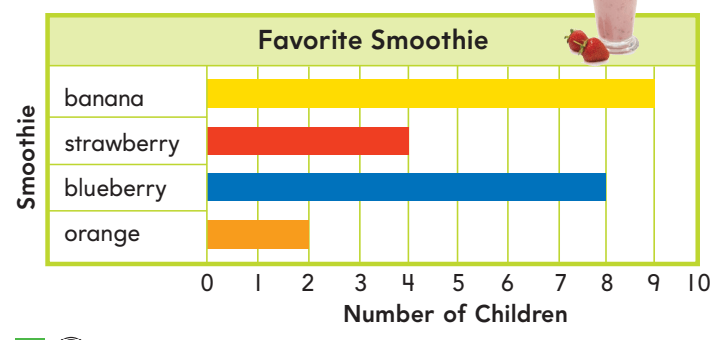
4 Children
500
A __________ is a way to collect data, or information.
Survey