Counting Tallies
Pictographs
Math words
Bar graphs
Bonus math questions
100
What is 2?
100
 Which fruit got the most votes?
Apples
100
A graph that uses little pictures.
What is a pictograph?
100

Which fruit is the favourite?
What is blueberry?
100
The number that comes after 17.
What is 18?
200

What is 5?
200
How many votes did banana get?
What is 6?
200
A graph we make by drawing bars of different heights.
What is a bar graph?
200

What snack got the least amount of votes?
What are crackers?
200
6 + 6 = ....
What is 12?
300

What is 7?
300

What is the least favourite flavour of ice cream?
What is peach?
300
In a pictograph, it tells us what each picture is worth. For example, one :) = 1 vote.
What is a key?
300

Which colour did they like better: red or blue?
What is red?
300
The number of days in a week.
What is 7?
400

What is 10?
400
How many more votes did pineapple get than vanilla?
What is 1?
400
What we use to organize tallies.
What is a tally chart?
400

How many people voted for softball?
What is 4?
400
10 - 3 = ....
What is 7?
500

What is 15?
500
 How many people voted for dog? Hint: look at the key.
What is 4?
500
A question you ask to gather data or learn information about a group of people.
What is a survey?
500
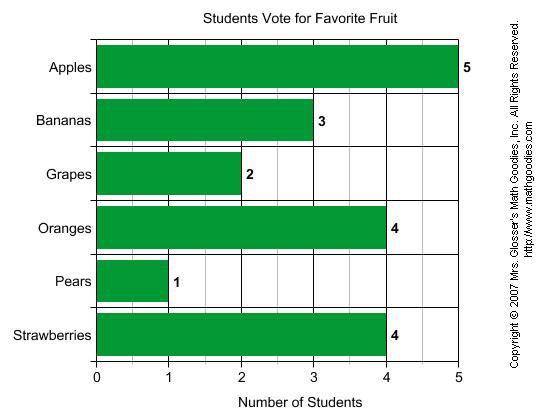
Which two fruits had a tie?
What are oranges and strawberries?
500
15 + 15 = ....
What is 30?