Descriptive Statistics
Process Metrics
Graphical Data Analysis
Random
Random
Double Jeopardy
100
Name the three measures of central locations of data.
What is mean, median, mode?
Double Jeopardy!
100
Metrics can be either (blank) or (blank).
What is Lagging or Leading.
100
The number one rule is to avoid using this at all costs.
What is a Pie Chart?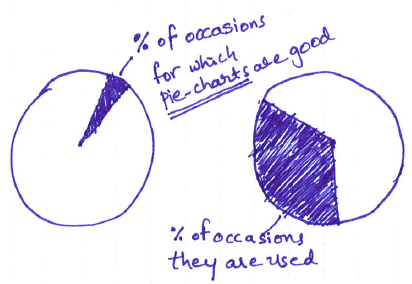
100
Useful for identifying peaks, valleys, or trends in data over time, this graph is enhanced when target data is presented.
What is a Time Series Plot?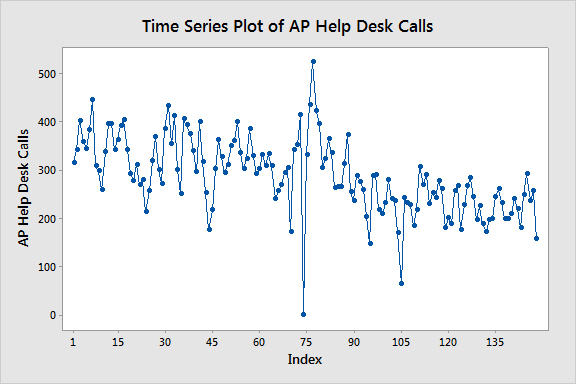
100
Define deviation.
What is distance between a data point and the mean?
100
Calculate the mean, median, and mode of this data:
1, 1, 1, 2, 5, 6, 6, 7, 7
Mean: 4
Median: 5
Mode: 1
200
Define any of the three measures of spread: Range, Standard Deviation, and Inter Quartile range.
What is Range (Max-Min), Standard Deviation (average deviation from the mean), or Inter Quartile range (range of the middle 50% of the data set)?
Double Jeopardy!!
200
The top 3 performance metric categories around the Voice of the Customer and the Voice of the business are?
What is quality, cost, and speed.
200
To study the strength of the relationship between two variables you would use this graph.
What is a Scatterplot?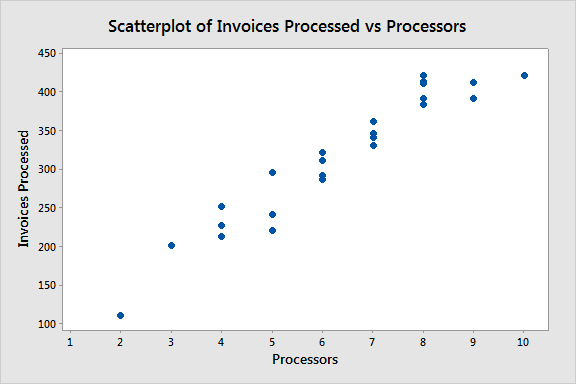
200
An item is considered defective when it contains one or more (blank).
What is Defect.
200
To ensure there is no unintended conclusions drawn from you graph, it is best to state your own conclusions here on the graph.
What is the Footnote?
200
One standard deviation happens at this point on the normal distribution curve.
What is inflection point?
300
These two measures define a normal distribution curve.
What is Mean and Standard Deviation? We can use these tools to predict the likelihood of values being near the center.
300
In the acronym, SIPOC, the "P" and the "C" stands for (blank) and (blank)?
What is Process and Control?
Double Jeopardy!
300
You might use this graph to assess and compare sample distributions, and identify outliers.
Hint: It has whiskers.
What is a Box Plot?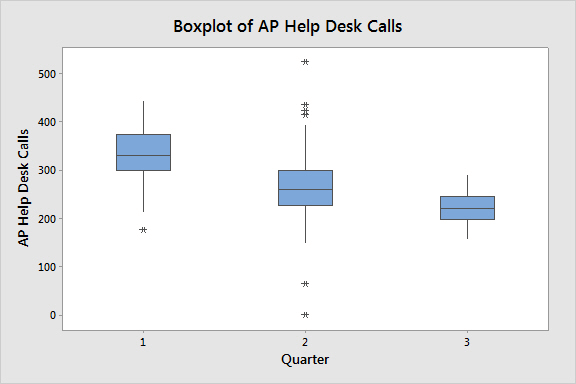
300
How are accuracy and precision different?
What is, accuracy is a measure of the average as compared to the target. Precision is a measure of the average distance between data points.
300
Little's law is the relationship between the (blank) and the (blank).
What is the WIP and the Exit Rate.
300
What does the rest of SIPOC stand for?
Supplier, Input, Process, Output, Customer
400
Describe the difference between a population and sample data.
A population includes all data observations, and a sample is a subset of the population that can give inferences about the population?
400
Output measures provide the best overall barometer of (blank).
What is Process Performance.
400
You can identify the central tendency, range, and varation extent of data using this graph.
What is a Histogram?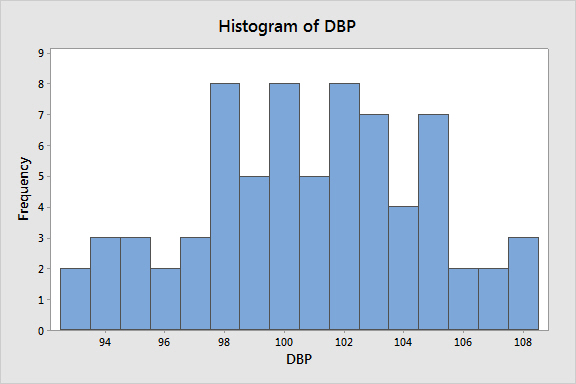
400
The acronym PCE, Process cycle efficiency, divides the (blank) by the (blank).
What is the Customer Value Added Time by the Process Cycle Time.
400
These are the three fundamental elements of bad graphical display, according to Gary Klass.
What are:
Data Distortion
Data Distraction
Data Ambiguity
DOUBLE JEAPORDY!!
400
Double Jeopardy: What university does Gary Klass represent?
Illinois State University
500
How many standard deviations would you need to go in a normal distribution to capture at least 99% of the data in?
What is 3 standard deviations? 3σ holds 99.7% of the data set.
500
Throughput yield is preferred over Final yield because TPY takes into consideration the (blank).
What is The Hidden Factory.
500
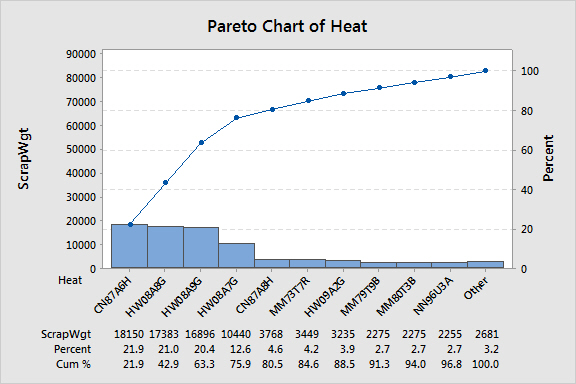
This graph shows the relative importance of the differences between groups of data using both lines and bars.
What is a Pareto Chart?
Double Jeopardy!!
500
Converting to a "standard" normal distribution enable us to do this.
What is finding the number of standard deviations (z value) a value is from the average? We can also find the probability of being below or above a value through the z value.
500
OEE is a measurement of (blank), (blank), and (blank).
What is Availability, Performance, and Quality.
500
Double Jeopardy: What is Pareto's first name and Nationality?
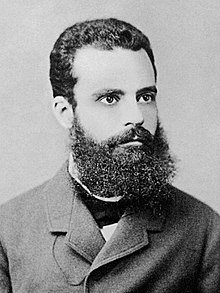 Vilfredo, Italian