Population Growth
Species
Biodiversity
Graphs
100
1. Find the carrying capacity of the graph below.
The carrying capacity of the population is 10,000
100
6. A species that is found where in its natural environment.
Native Species
100
11. The most biodiverse place in the world!
Tropical Rainforest
100
16. How do you find the scale of the x and y axis?
Largest # - Smallest # / Number of Lines
200
2. What type of growth does the graph below show? 
Exponential Growth
200
7. A species that is found in a place other than its natural environment.
Invasive Species
200
12. The variety of species in a given area.
Biodiversity
200
17. What is a trend?
 Pattern or what is happening on the graph.
300
3. What type of population growth does the graph below show?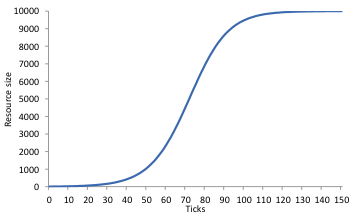
Logistic Growth
300
8. Which of the following is NOT a producer?
1. Rabbit
2. Tree
3. Fruit
4. Grass
A rabbit is not a producer.
300
13. A food chain always begins with this type of organism.
 Producer
300
18. Type of graph that shows changes over time.
Line Graph
400
4. Which type of growth do most larger mammals show?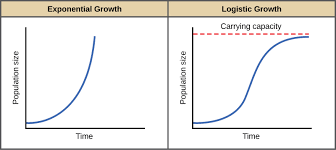
Logistic Growth
400
9. How do consumers get energy?
By eating food!
400
14. What would happen if grass was eliminated from the ecosystem below?

Everything would die!
400
17. Type of graph that is great at comparing two things.
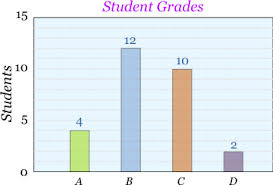
Bar Graph
500
5. What are three examples of limiting factors?
Food, Water, Space, Weather
500
10. How do producers get energy?
photosynthesis (the sun)
500
15. What would happen if grass was eliminated from the food web below?

Not much, there are other producers they can eat.
500
20. In a double line graph is important to have this so you can tell which line refers to each.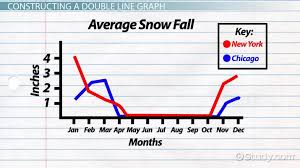
Key