Gunter
Gleiben
Glauchen
Globen
All Right
100
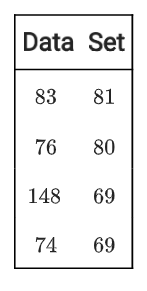
Find the Mean

85
100
Find the Mean without the outlier

72
100
Compare Data Set A and Data Set B
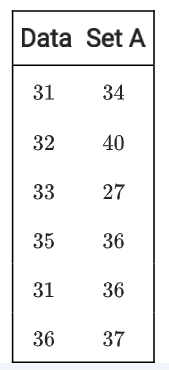
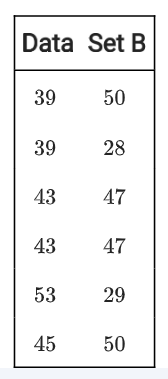
The values for Data Set B are more spread out.
100
Describe the shape of the distribution.

Skewed right.
100
Which data set is more spread out?

Set B
200
Find the Median
78
200
Find the Median without the outlier.

73
200
Find the Range.
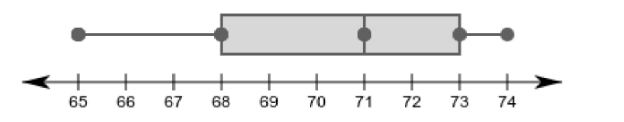
9
200
Which measure of center best represents the data?

Median
200
Describe the shape of each distribution.
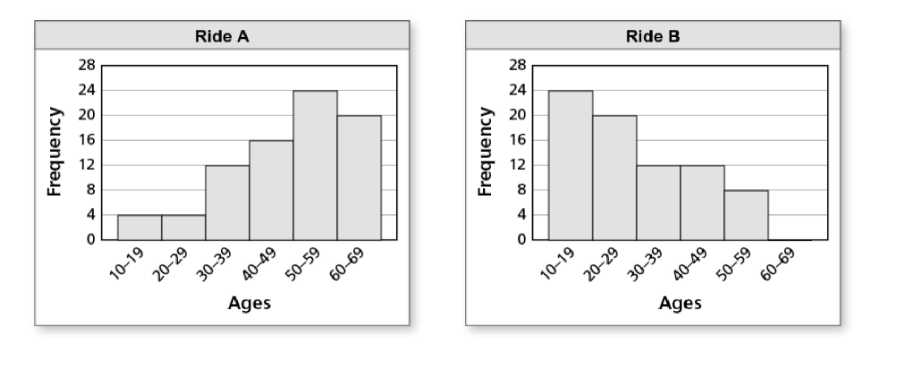
Ride A is Skewed Left
Ride B is Skewed Right
300
Find the Mode

69
300
Find the mode without the outlier.

63
300
What percent of the data is between 73 and 74?

25%
300
Which measures of variation best represent the data?

five-number summary
300
Which ride has younger riders?

Ride B because most of the data values are on the left.
400
Which measure of center best represents the data?

The Median
400
Find the Range of Data Set A

13
400
Find the Interquartile Range.

5
400
Identify the shape of Set A

Skewed left
400
The ages for which ride are more variable?

Ride A
500
Identify the outlier and how can you prove it?
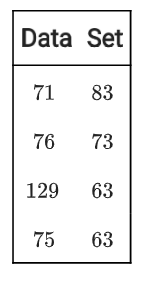
129
79.4+1.5(12.5)=92
Q3+1.5(IQR)
500
Find the Range of Data Set B.

25
500
Are the data more spread out below Q1 or above Q3?

Below Q1 because it is longer.
500
Identify the shape of Set B
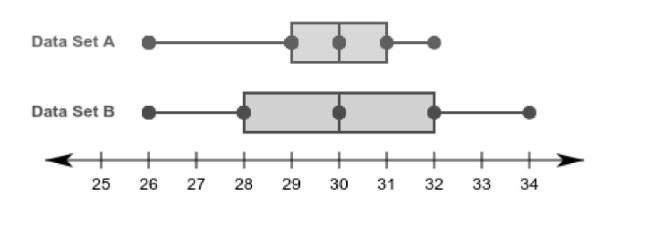
Symmetric
500
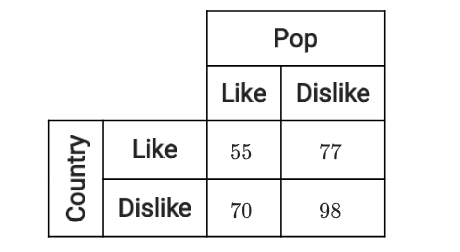
Make a two-way table that shows the conditional relative frequencies based on the column totals.