16-2 Line Plots
16-4 Pictographs
16-5 Bar Graphs
16-6 Problem Solving
100
Use the line plot below. Which high temperature occurred most often in May?
A. 68 F
B. 69 F
C. 70 F
D. 71 F
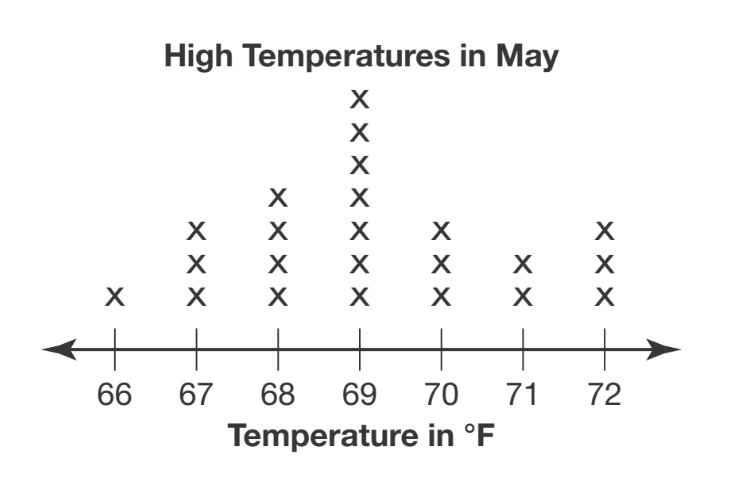
B. 69 F
100
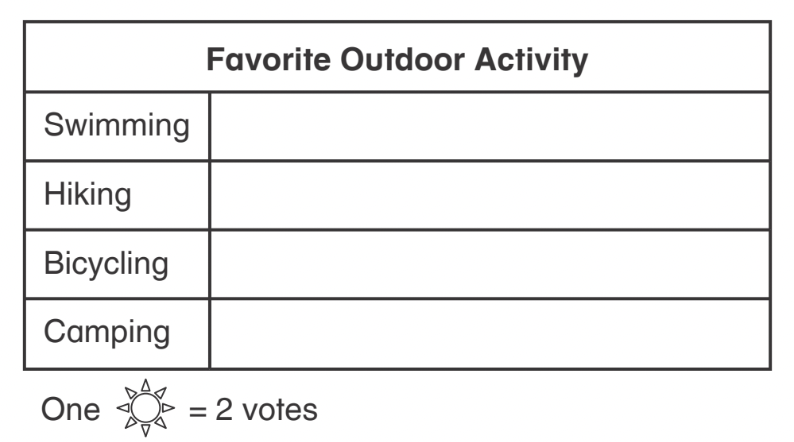
Amanda asks her friends about their favorite outdoor activity. The tally chart shows her findings.
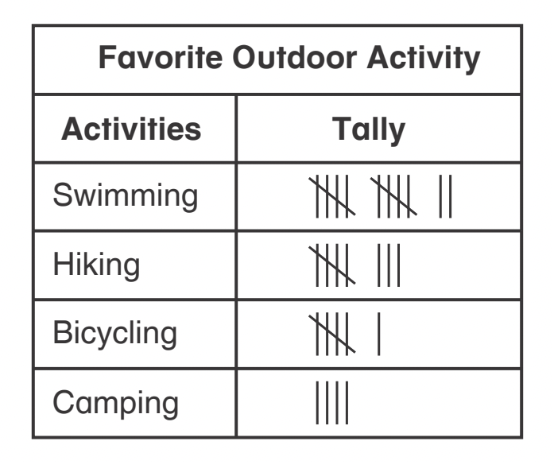
Use the tally chart above.
How many symbols would you need to draw on the graph to show that 16 students said soccer was their favorite outdoor activity?
𝖠. 4 symbols
𝖡. 8 symbols
𝖢. 12 symbols
𝖣. 16 symbols
B. 8 symbols
100
Look at the bar graph below. How many more points did Joanna score than Ada in the basketball game?
A. 8
B. 3
C. 5
D. 13
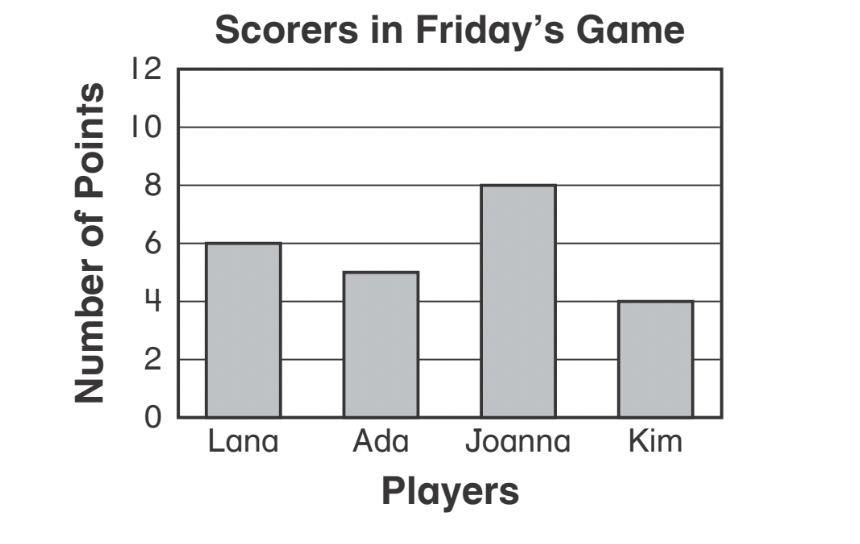
3 points
8-5=3 points
100
Look at the pictograph below. How many fewer comic books does Rafael have than Joel?
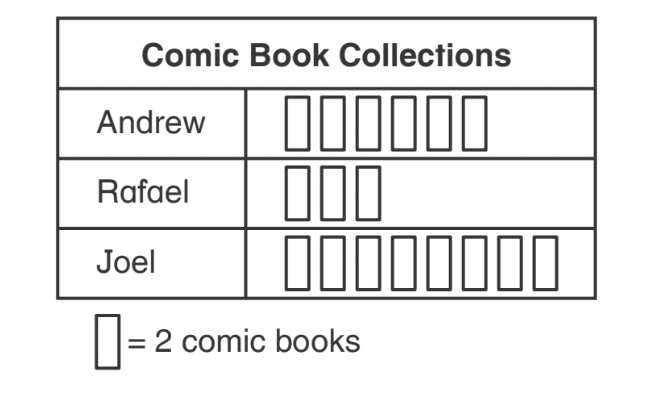
10 comic books
Each block = 2
2x5=10 books
200
Carolyn spun a numbered spinner 15 times. The line plot below shows her results.
According to the graph below, what section did Carolyn spin the most?
A. 1
B. 3
C. 2
D. 4
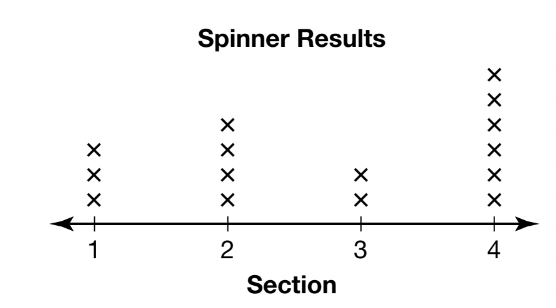
D. 4
200
If Simone knows that there are 60 people who like biking as their favorite sport, how many symbols should she draw for biking? Use the pictograph below.
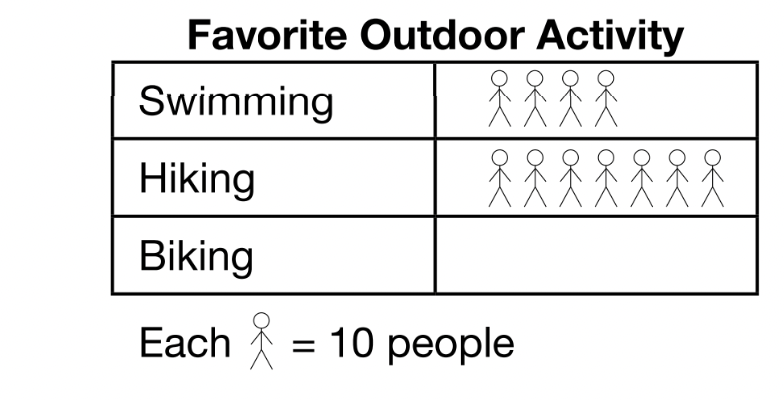
6 symbols.
Each symbol = 10 people
6x10=60 people
200
Jin took a survey and made the tally chart shown.
Jim uses the data in his tally chart to make a bar graph. Which initial will have the tallest bar on the bar graph?
A. K
B. R
C. C
D. K and R will be the same
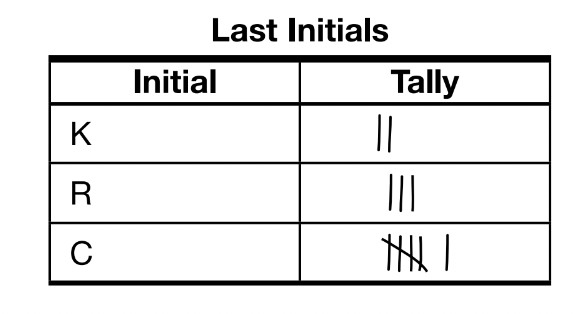
C. C
200
How many more 3rd grade students chose rock music than 4th grade students? Use the charts below.
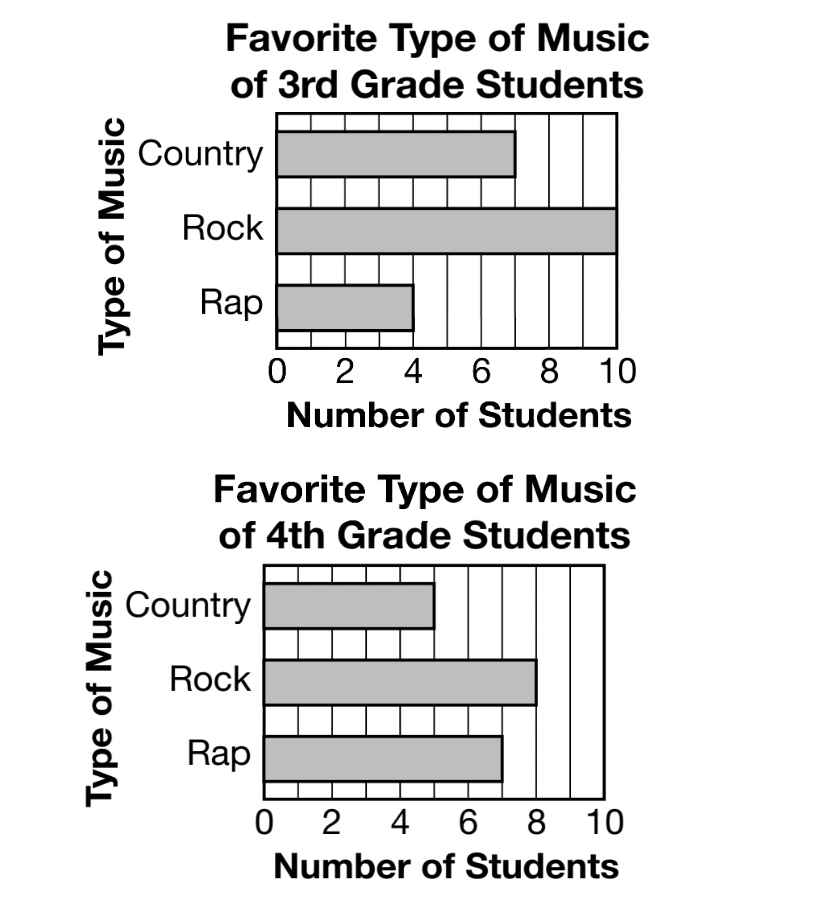
2 students
300
What is the most common length of pillow that Emily has collected? Use the chart below.
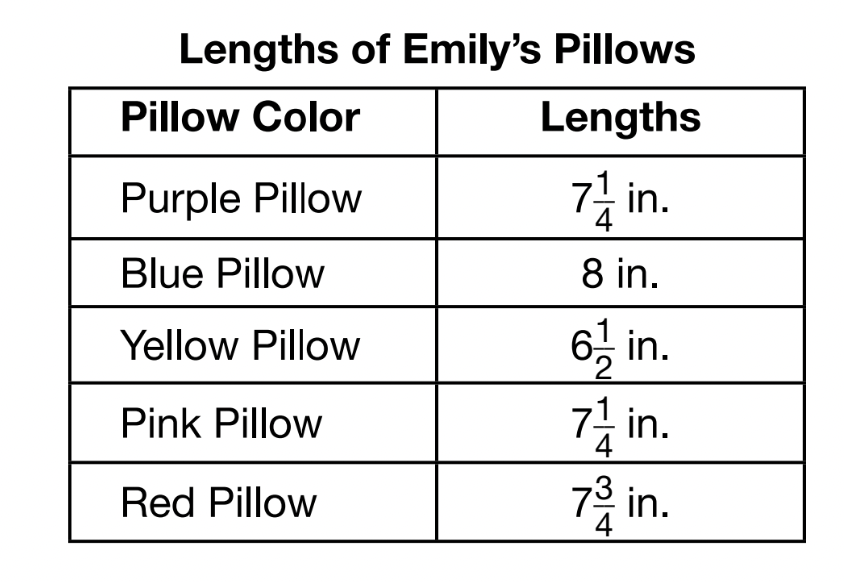
7 1/4 in.
300
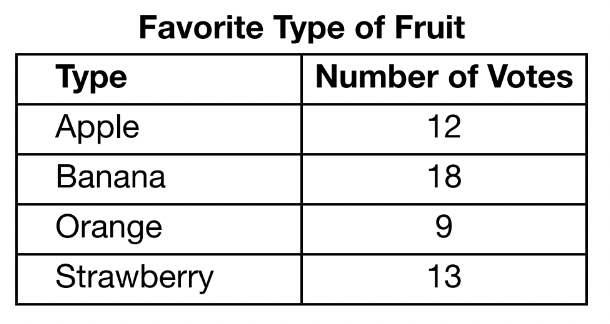
Amir wants to make a pictograph to display the data. How many votes should each symbol in his pictograph stand for? Use the table below. 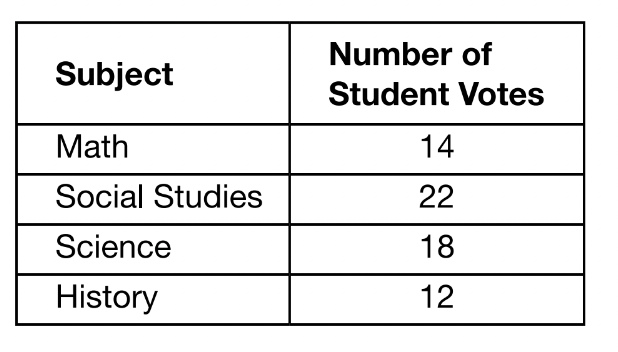
2 or 4
300
Use the chart below. Write the number that makes the statement true.
________ more students chose football as their favorite sport than chose basketball.
A. 12
B. 9
C. 15
D. 6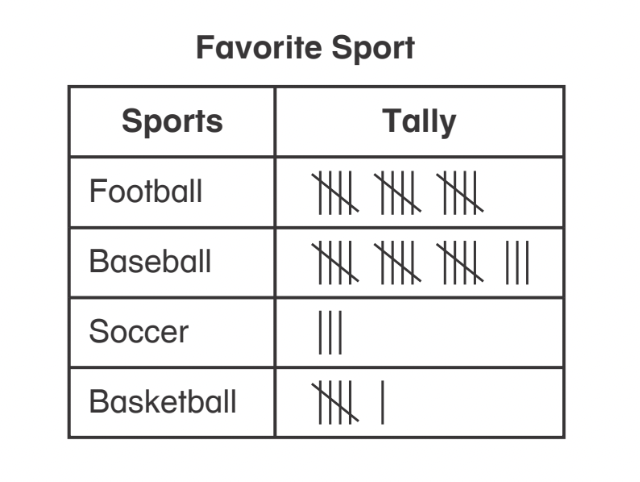
B. 9
300
Which statement about the data in the graphs is true? Use the charts below.
A. More students in grade 4 than grade 3 like rap music.
B. More students in grade 4 than grade 3 like rock music.
C. The same number of students in both grades like country music.
D. Rap is the least favorite in both grades.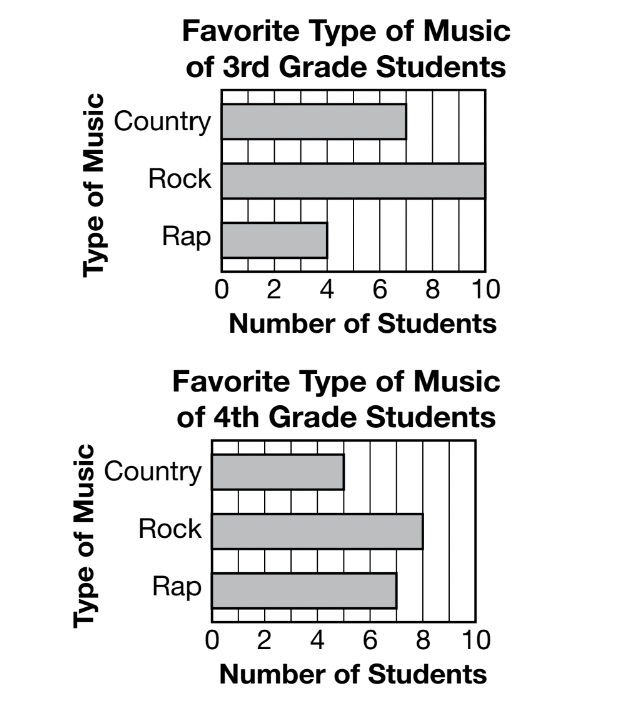
A. More students in grade 4 than grade 3 like rap music.
400
Emily likes to collect colored pillows for her bedroom. Draw a line plot to show the lengths of her pillows. Use the table below.
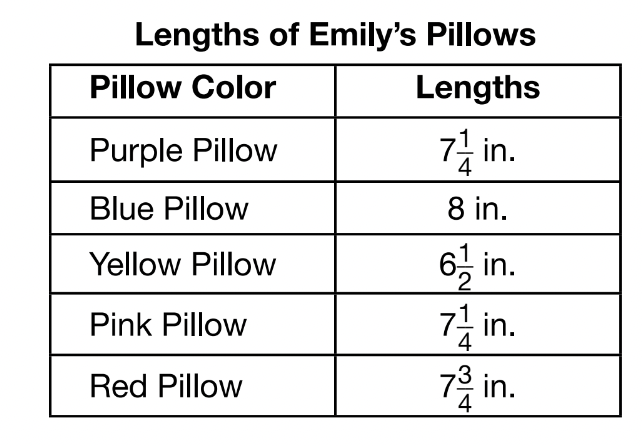
Teacher check students' work.
400
Amanda asks her friends about their favorite outdoor activity. The tally chart shows her findings.
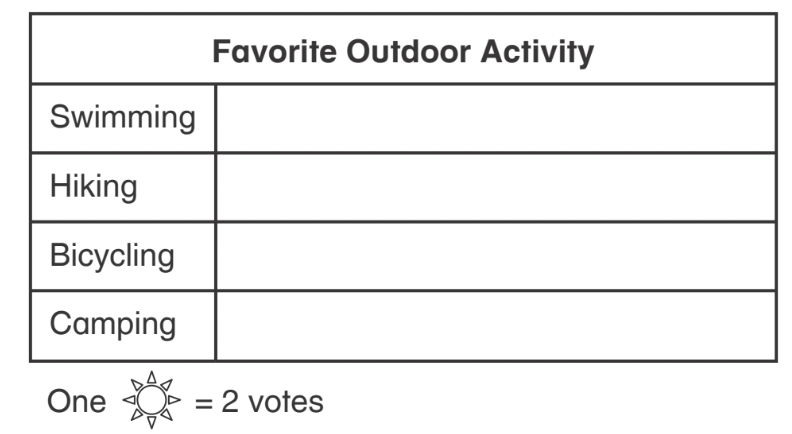
Use the tally chart above and the key below to complete the pictograph.
Teacher check students' work.
400
Make a bar graph to show the data in the chart.
Teacher check students' work.
400
Explain how Amir would represent the value for Science if each symbol in his pictograph stood for 6 votes.
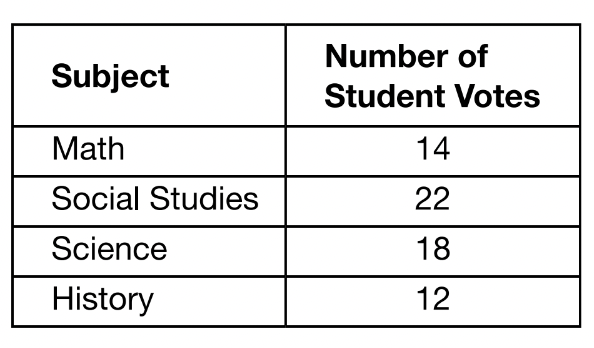
Amir would draw 3 symbols in the pictograph.
Each symbol = 6 votes
6x3=18 votes