Scatter Plots & Association
Trend Lines
Two-Way Tables
Relative Frequency
Misc.
100
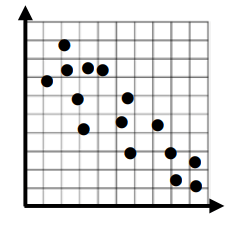
State the type of association, whether it is strong or weak, and if it is linear or non-linear.

Non-Linear
100
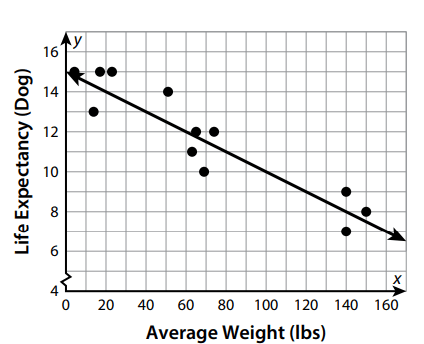
Is this a good trend line for the data in this scatter plot? State yes or no and why.

No, the trend line is below most of the data points.
100
How many total teachers were surveyed?

77 teachers
100
What type of relative frequency table is this?

Row Relative Frequency Table
100
A point that does not fit the overall pattern or trend of a scatter plot is known as a ________
outlier
200
Hector surveyed 500 people and asked them how far they drive to work and what the last digit of their phone number is. What type of association would this scatter plot have?
No association
200

U
200
How many students think there should be final exams?

22 students
200
What is the relative frequency of the students surveyed that want final exams?
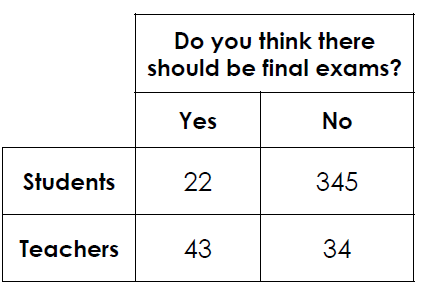
6%
200
A _______ is an area on the graph that contains no data.
Gap
300
State the type of association, whether it is strong or weak, and if it is linear or non-linear.
Negative, Weak, & Linear
300
What is the slope of the trend line in this scatter plot?

slope = 25
300
How many students were surveyed in all?

311 students
300
What percent of students who do not ride a bus are seventh graders? 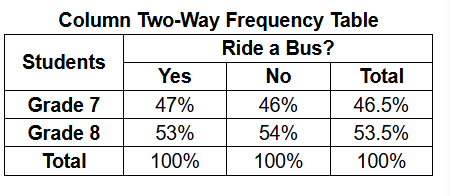
46%
300
__________ occurs in a scatter plot when there are distinct or separate groups of points.
Clustering
400
The outlier(s) is(are)

(2,39), (5,27), (10,3)
400
Write an equation for this line
y = -1/20 + 15
400
How many boys never send a letter?
30
400
What is the relative frequency of all students who chose burgers? Round to the nearest tenth.

23.5%
400
This association show that your y-values are decreasing as your x-values are increasing
Negative Association
500
Where is(are) the cluster(s)?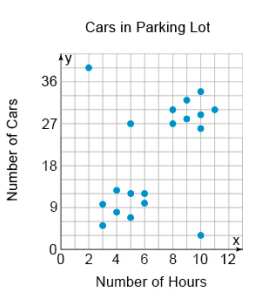
between 3 and 6 hours (5 to 13 cars)
between 8 and 11 hours (26 to 34 cars)
500
Write the equation of the trend line from this scatter plot:
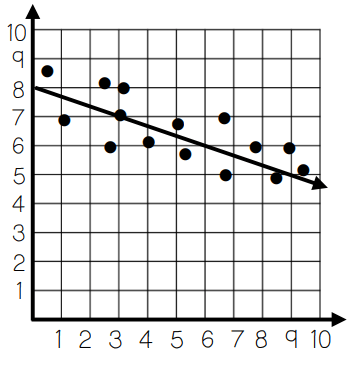
y=-1/3x+8
500
How many overnight deliveries are there?
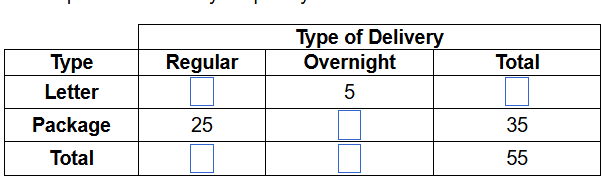
15
500
What is the relative frequency of 8th graders that did not choose pizza? Round to the nearest tenth.

31.6%
500
What is is called when the change in one variable has no effect on the second variable.
No association