Data Measures
Populations, Samples, and Inferences
Box Plots
Dot Plots
100
What is the median?

4
100
Marcy wants to know what type of book is most commonly checked out by visitors of the public library. She surveys people in the children's reading room between 1:00 and 2:00 on Saturday.
What is the population of her study?
Visitors of the public library.
100
What is the median commute time for this sample?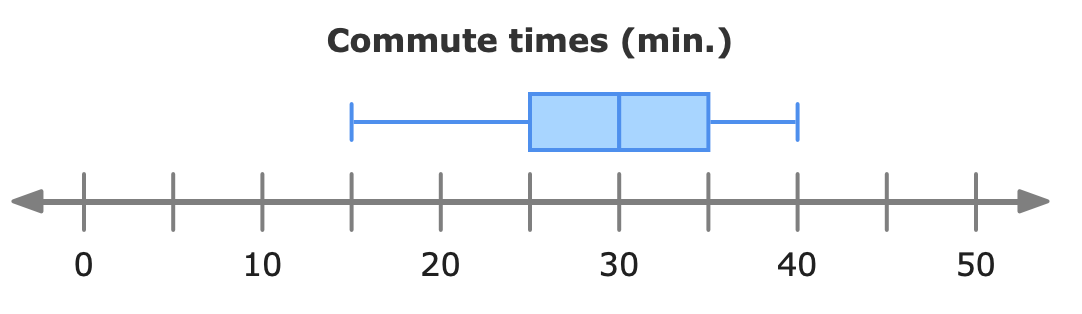
30 minutes
100
What is the mode number drawn in this sample?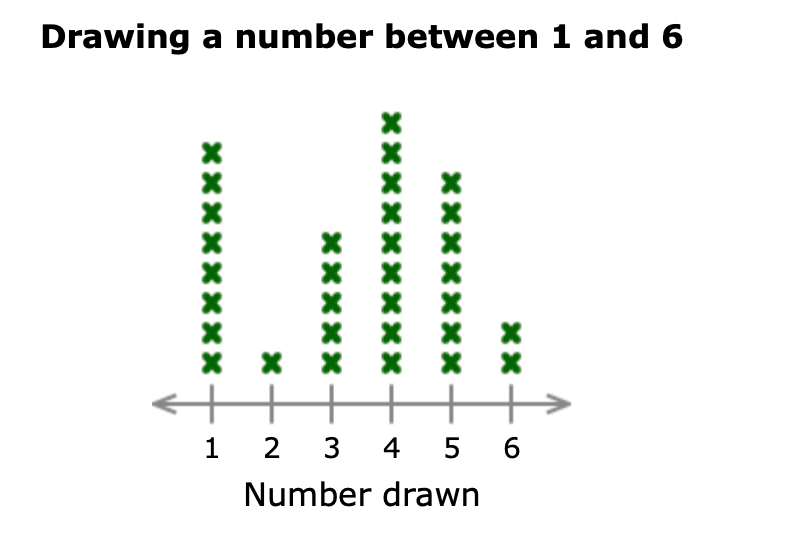
4
200
What is the mode?
7
200
Marcy wants to know what type of book is most commonly checked out by visitors of the public library. She surveys people in the children's reading room between 1:00 and 2:00 on Saturday.
Is her sample representative of the population? Why or why not?
No (because not all of the visitors go to the children's reading room)
200
What is the range in weight for this sample of apples?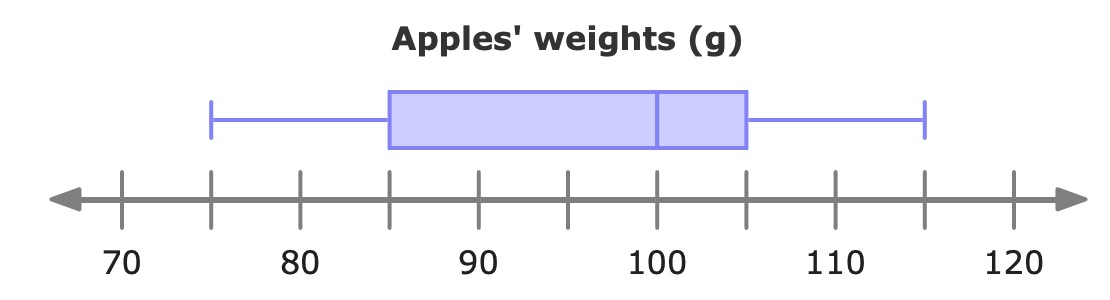
40 grams (115-75)
200
What is the median number of finger puppets made in this sample?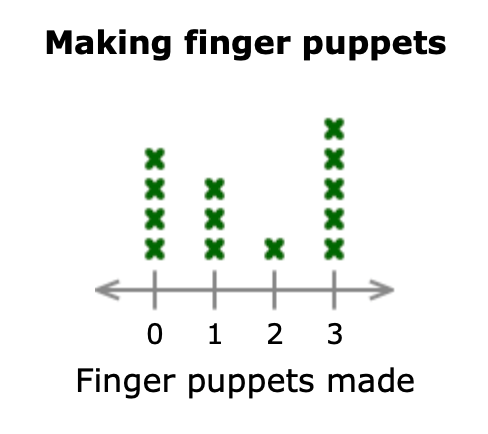
1 puppet
300
What is the range?
3.5
300
Michael surveyed a random sample of 60 students in his school about the number of sports they play and found that 15 play exactly one sport. How many of the 300 students in his school can he infer play exactly one sport?
75 students (15/60=75/300)
300
What is the IQR for the box plot?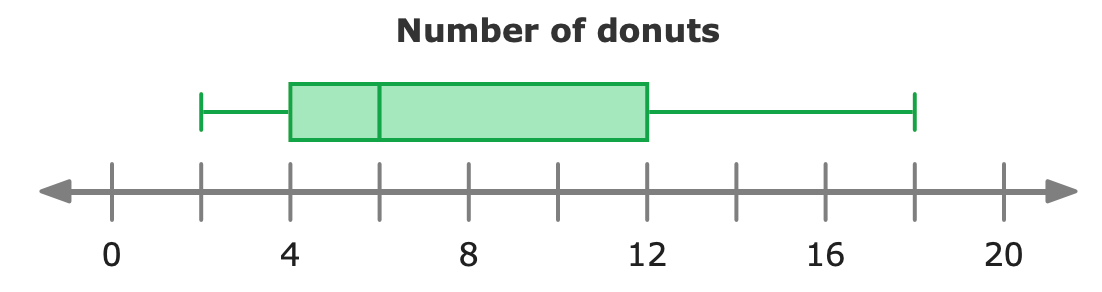
8 donuts (12-4)
300
To the nearest tenth, what is the mean number of photographs taken?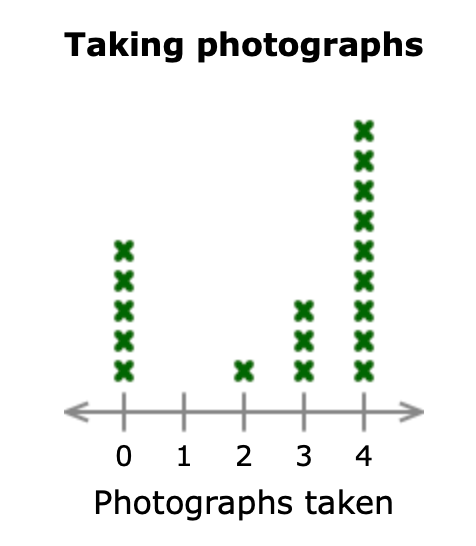
2.6 photographs (47/18)
400
What is the IQR?
3
400
In a representative sample of 150 spectators, 50 said they attended 5 or more games. How many of the 2,400 spectators in total can we assume attended 5 or more games?
800 spectators (50/150 = 800/2400)
400
Use the measures of center (medians) to make a comparative inference about the aquarium events.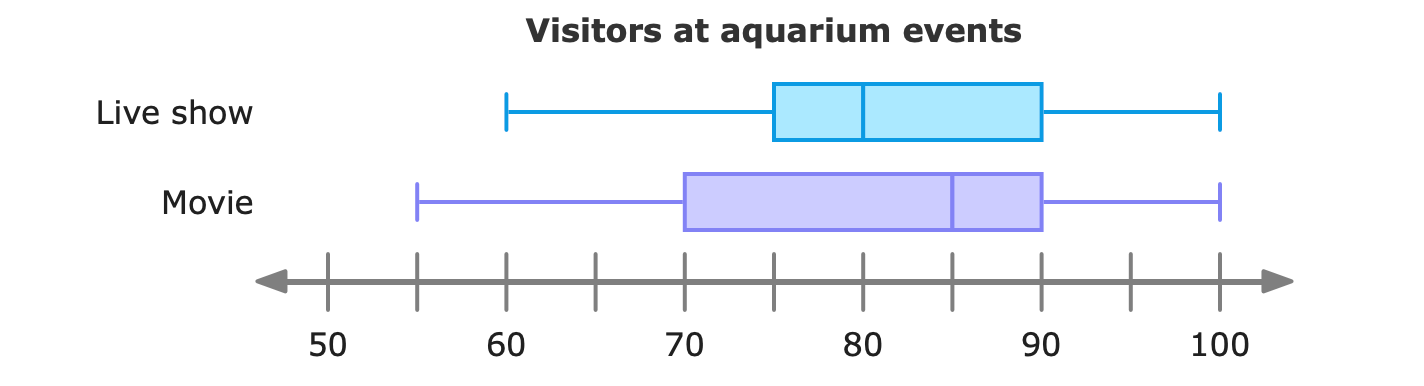
The median visitors of the movie is 85, which is greater than the median visitors of the live show, 80. This means there are generally more visitors at the movie.
400
Use the means to make a comparative inference about numbers of siblings.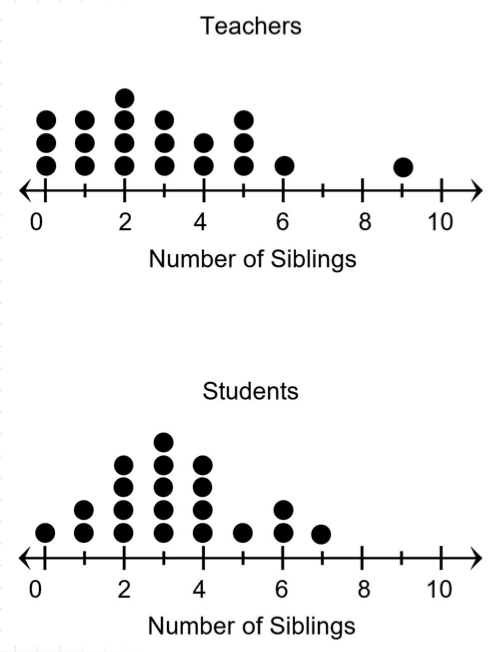
The mean of the teachers is 2.9 and the mean of the students is 3.35, so in general the students have more siblings than the teachers do.
500
To the nearest tenth, what is the MAD?
2.7
500
Pam surveyed 18 students at her school about their favorite classes. Of the students surveyed, 6 said their favorite class was English. How many of the next 12 students surveyed should she expect to pick English based on past data?
4 students (6/18 = 4/12)
500
Use measures of variability (IQR and range) to make a comparative inference about the puppies.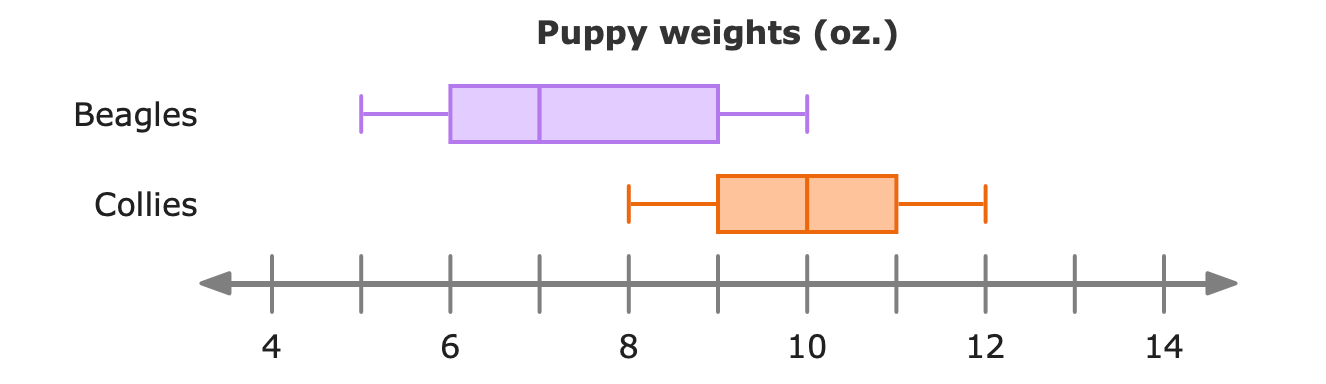
The beagles have a range of 5 and an IQR of 3, which is greater than the collies which have a range of 4 and an IQR of 2. This means there is more variation among the weights of beagles and the weights of collies are more consistent.
500
Use range to make a comparative inference about the data.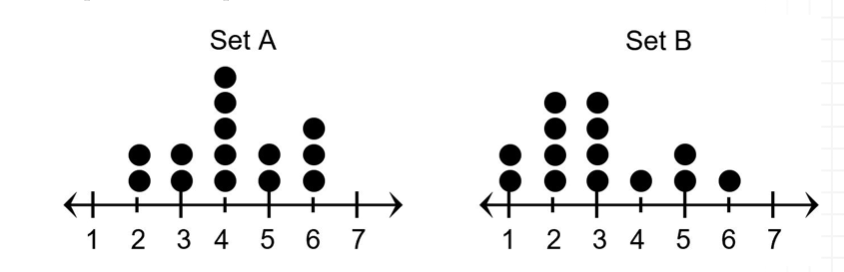
The range of Set A is 4 and the range of Set B is 5, so Set A is more consistent and Set B has more variability.