Vocabulary
Measures of Center
Box Plots
Frequency Tables & Histograms
M.A.D.
100
What makes a question statistical?
open ended, varied responses, opinion/options, etc.
100
What is the mode of the data set?
7, 10, 10, 6, 7, 8, 8, 7, 9
7
100
What are the 5 data points called that you need for a box plot? List them.
5 Number Summary
Minimum, Maximum, Q1, Median, Q3
100
True or False: You can make an accurate histogram without a frequency table.
False. You need the frequency table for accurate data.
100
How do you find the Interquartile Range (IQR)?
Q3 - Q1
200
What are the measures of center?
mean, median, mode, range
200
What is the range of the data set?
167, 178, 193, 196, 199, 199, 203, 209, 217, 220, 221
221 - 167 = 54
200
True or False: When you draw a box plot, dots go above the minimum and maximum and a horizontal line goes above the Q1, Median, and Q3.
False
200
What are intervals?
The range of numbers that we use to help describe a data set
200
The information below is from a box-plot previously created. Using the data, find the IQR.
Minimum - 78
Maximum - 84
Q1 - 79
Median - 80
Q3 - 82
82 - 79 = 3
300
What are the 3 things we can make from a data set?
box-and whisker plot, frequency table, histogram
300
What is the median of the data set?
4, 6, 8, 8, 9, 13, 13, 14, 15, 16
11
300
What is the median?
7, 10, 10, 6, 7, 8, 8, 7, 9
8
300
Create a histogram based on the frequency table below.
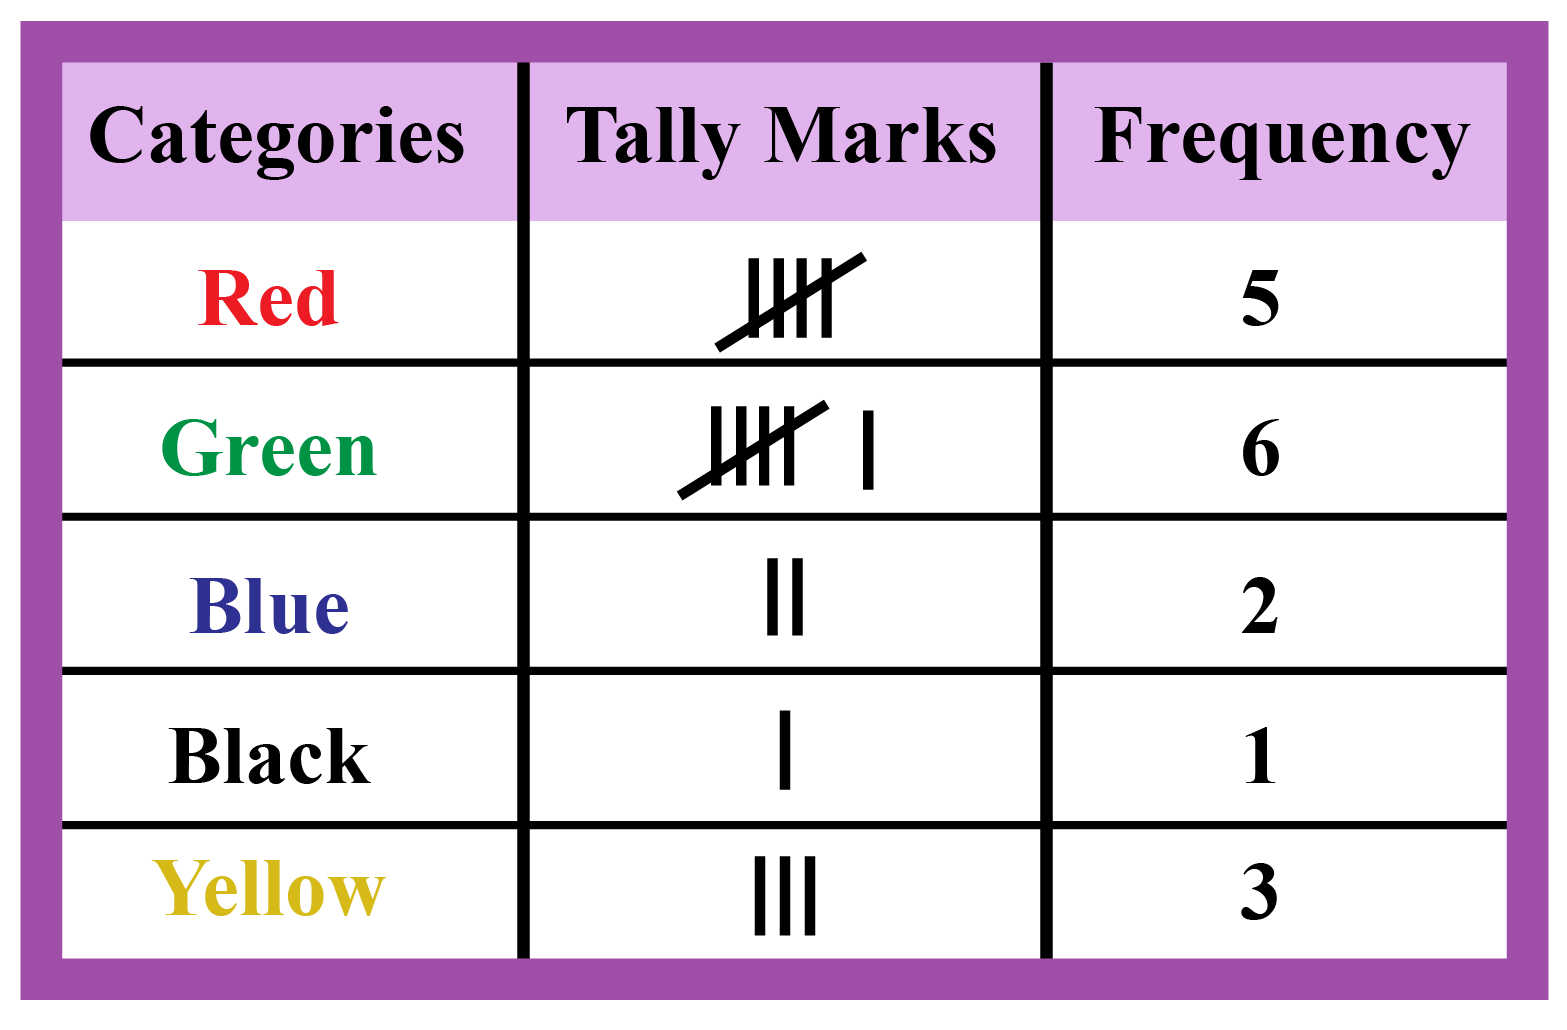
*Check student scores. Intervals should colors. Frequency from 1-6
300
How do you find the Mean Absolute Deviation?
1) Find the mean of the data set if it is not given to you.
2) Find the difference between the mean and each number in the data set.
3) Find the mean of all the differences from Step 2.
400
What is the M.A.D. and why do we use it?
Mean Absolute Deviation; to show how varied the individual data points are from the mean (average) data point
400
Find the mean. Round your answer to the nearest hundredth.
5.46, 5.92, 2.95, 5.06, 4.1, 5.45, 5.07, 5.06, 5.9
5
400
What are the Q1 and Q3 of this data set?
7, 10, 10, 6, 7, 8, 8, 7, 9
Q1 - 7
Q3 - 9.5
400
Is the lowest amount of money earned between $41-$50?

No. The interval 41-50 has the lowest amount of people that earned that much money. The lowest amount of money earned is between $1-$10.
400
Caleb's quiz scores are 75, 81, and 90. The mean score is 82. What is the M.A.D. of his data set?
1). Mean (average) = 82
2) Differences:
82 - 75 = 7
82 - 81 = 1
90 - 82 = 8
3) Average of the differences.
7 + 1 + 8 = 16
16 / 3 = 5.333333333
500
What does the IQR represent?
Middle 50% of the data
500
Using the data set below, what is holds a bigger value: the mean or the median?
42, 42, 23, 75, 64
median - 42
mean - 49.2
the mean
500
Create a box plot for the data set below.
71, 73, 74, 76, 76, 80, 81, 81, 83, 84
Min - 71
Max - 84
Q1 - 74
Med - 90
Q3 - 83
500
Use the data set pictured to create a frequency table and histogram.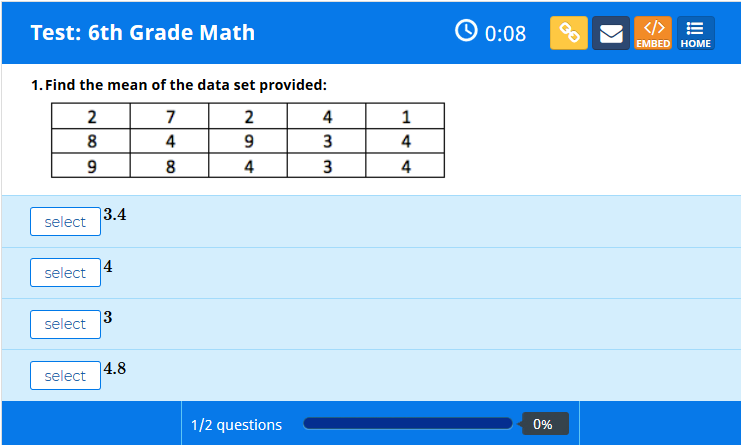
Check student work.
500
Find the M.A.D. of the data set.
10, 15, 20, 30, 50
1) Average = 25
2) Differences: 15, 10, 5, 5, 25
3) Average of Differences: 12