Correlation
Least Squares Regression
(y hat)
(y hat)
Vocabulary
Interpreting 2-Var Statistics
100
Two variables have a negative correlation if as x increases, y _____________________.
Decreases
100
Suppose yhat = 23.2 + 11.056x
Use the yhat equation to predict the y value when x = 22.
yhat of 22 = 266.432
100
The independent (x) variable is given this name, because it helps us predict values of y.
Explanatory
100
The correlation between years of experience and high score playing Flappy Bird is r = 0.2. Interpret this value. (Direction, Form, Strength)
The correlation between years of experience and high score is weak, linear, positive.
200
Two variables have a positive correlation if as x increases, y ________________.
Increases
200
If we removed the circled point from the data set, how would the regression line equation change?
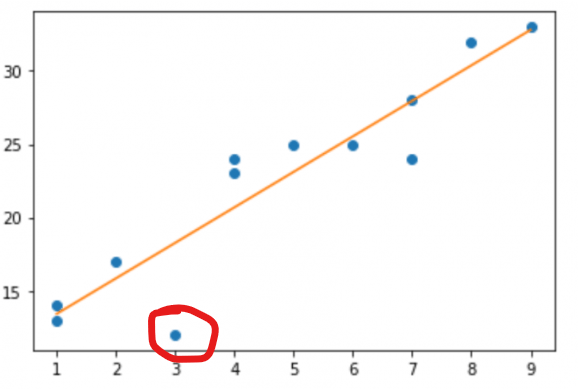
Slope increases, y intercept decreases
200
The dependent variable (y) is given this name because it may be predicted by the x value.
Response variable
200
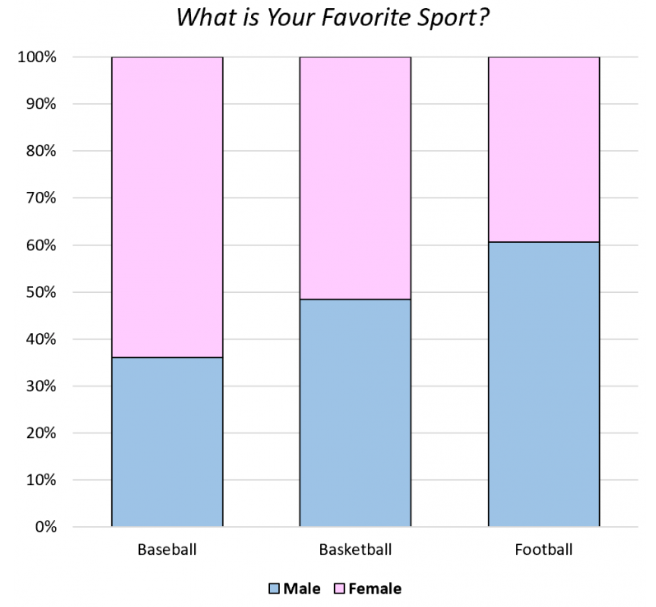
The segmented bar chart above shows the relationship between gender and preferred sports. Interpret this chart. (Is there an association?)
There is an association, the bars are segmented differently so gender may help us predict preferred sport.
300
Describe the correlation. (Direction, Form, Strength, Unusual Features)
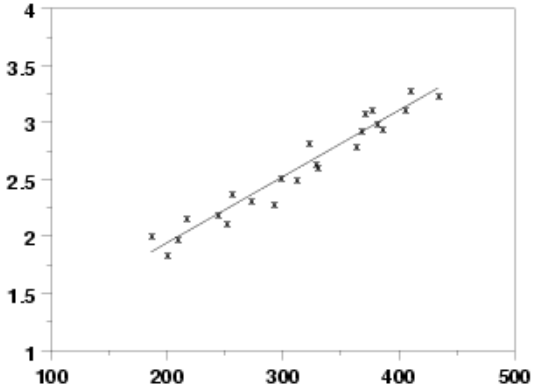
Positive, Linear, Strong, No Outliers
300
When plotting a scatterplot, which axis does the explanatory variable go on?
x - axis
300
To use data to make predictions about values within your data set is called ____________________.
Interpolation
300
A data set has a coefficient of determination r2 = 0.84.
Interpret this statistic.
36.5% of variation accounted for by model
400
Suppose r = 0.92. Describe the correlation based on this statistic. (Direction, Form, Strength)
Strong positive linear correlation
400
yhat = -124.1 + 20.954x
Find the residual for (6, 5).
Round to 3 decimal places.
y - yhat
5 - 1.624 = 3.376
400
Statisticians use this word to describe the relationship between two variables. You may describe it by its direction, form, strength, and unusual features.
Correlation
400
yhat = 32.803 + 125.677x
What is the slope of the yhat equation?
125.677, the predicted y value increases 125.677 as x increases by 1
500
Estimate the value of r for this regression line:
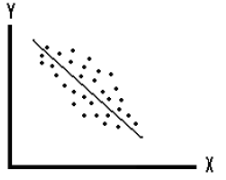
Acceptable: -0.6 > r > -0.9
Negative, strong
500
Based on the residual plot, is the model appropriate for the data set? Why or why not?
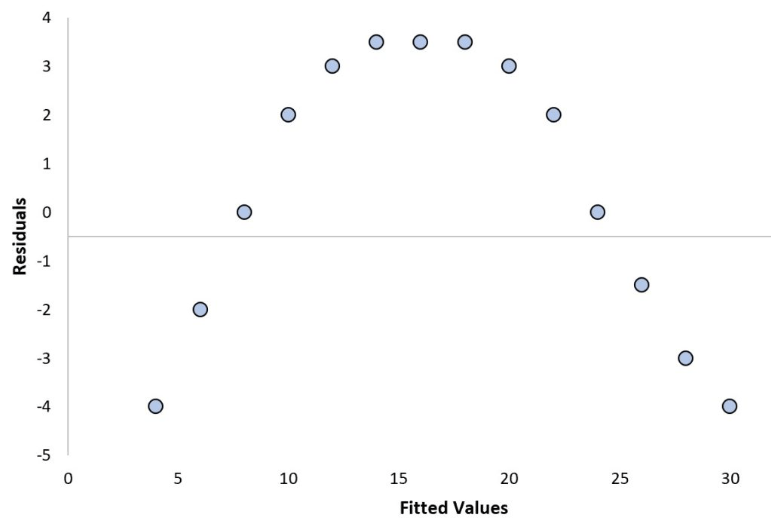
Not appropriate because residuals show a clear curve pattern
500
To use a model to make predictions using values outside of a data set is called _________________. You must be very careful because using values far outside the set will make predictions inaccurate.
extrapolation
500
The standard deviation of residuals for a data model is s = $12.23. Interpret this statistic.
Average difference between real and yhat value is $12.23