 How many males like basketball?
15
 How many beach visitors were there when it was 84 degrees?
225
When is a correlation coefficient considered to be strong?
When it is close to -1 or 1.
What is another name for the linear regression line?
Line of best fit
How do you turn a fraction into a percentage?
CTRL and Enter (Turn to decimal)
* 100
Finish the two way table:

M F Total
Can Swim 26 23 49
Can't Swim 4 27 31
Total 30 50 80

A person's bodyweight has no correlation with their income
Organize the following statements into two groups, causal and non-causal:
a) I stub my toe and say "ow".
b) It is cloudy and the weatherman says it will rain.
c) A man goes to work and his children receive toys.
d) Winter jacket sales and heating bill.
Causal: A, B
Non-Causal: C, D
What does the linear regression line tell us?
The approximate trend of data
Where did Mr. Beilinson go to college?
SUNY Oswego
 Put the following percentage in a sentence: 55% (from 12/22)
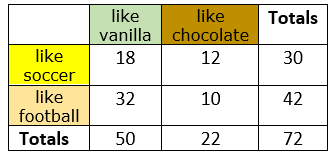
55% of chocolate lovers like soccer.

What temperature can you expect it to be if you hear 20 chirps
~52 degrees
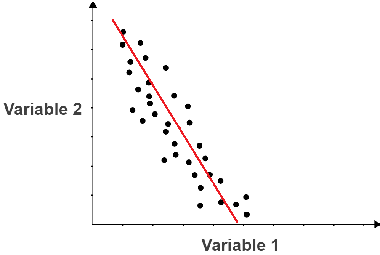
 How would you describe this correlation (Strong or weak? Negative or positive?)
A data set has a linear regression line of y = 24x + 15
Is this a positive or negative correlation? How do you know?
Positive
Because of the positive slope
How do you find the correlation coefficient after inputting data?
Menu
Statistics 4
Stat Calculations 1
Linear Regression (mx + b)
Look for r
What percent of females drive sports cars?
25%
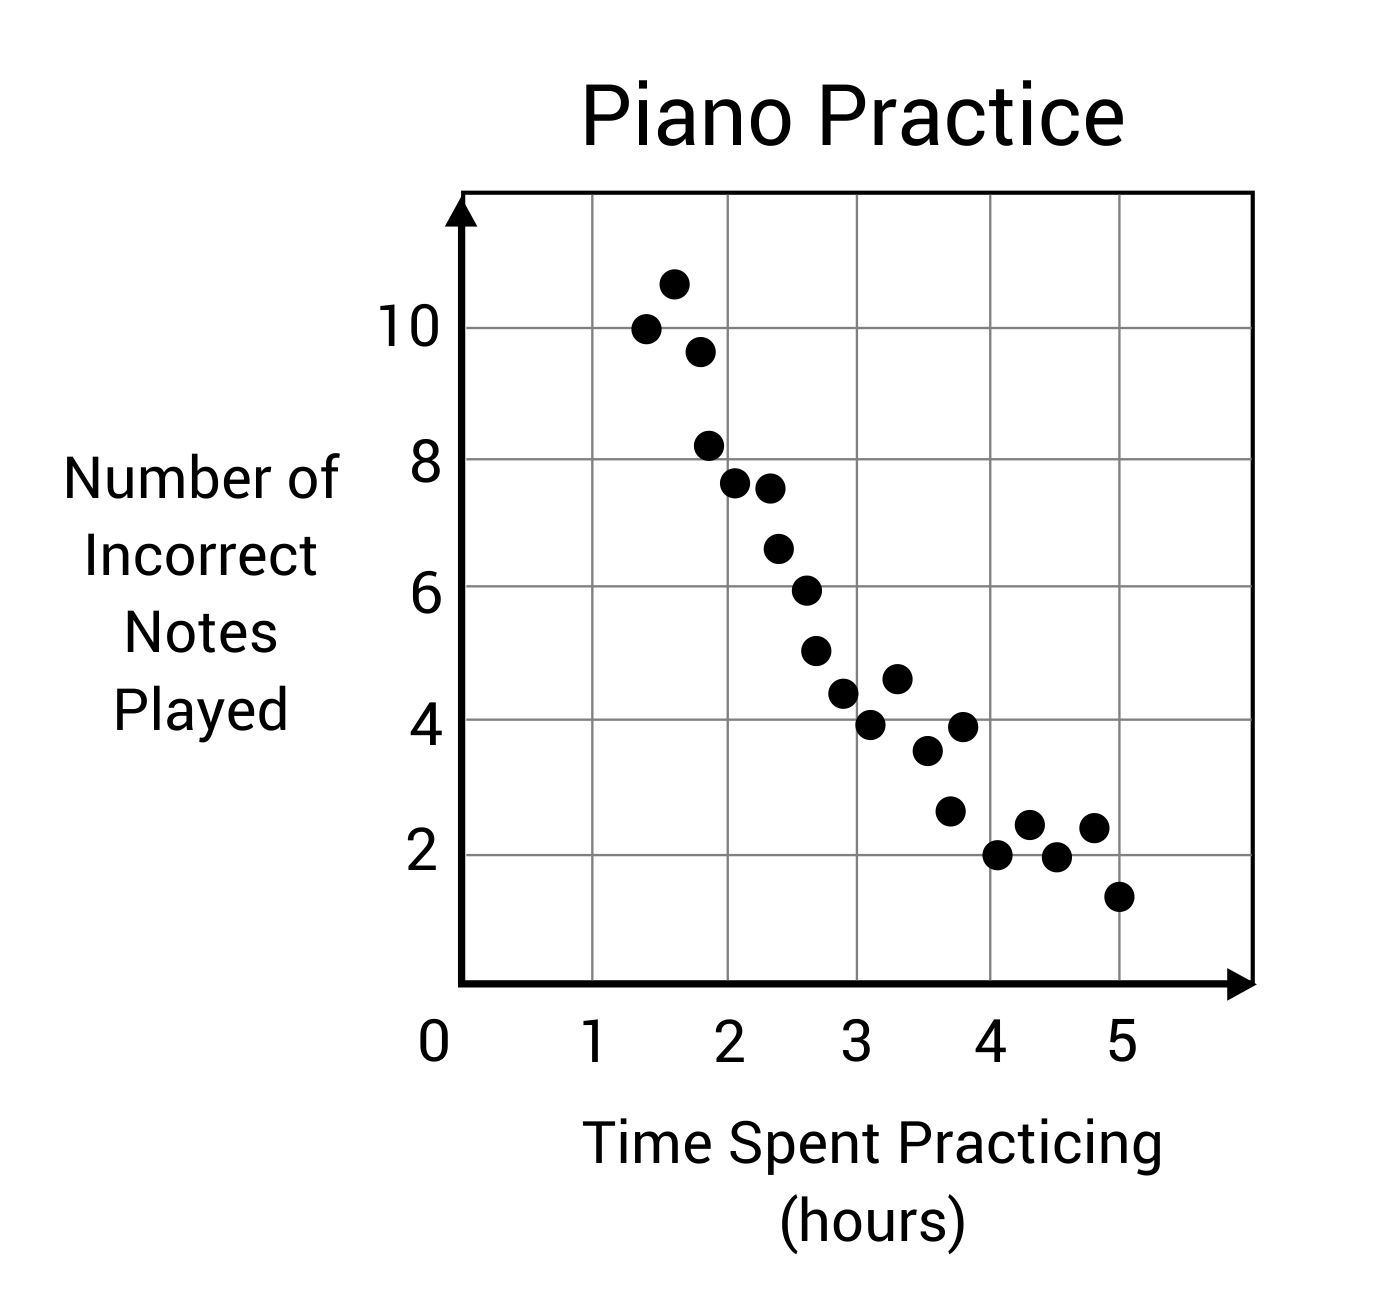
How can you tell if a scatter plot has a strong correlation?
If the dots follow a specific trend (linear increase/decrease)
 Find the correlation coefficient of this data, rounded to the nearest hundredth. Describe the strength (weak/strong & negative/positive)
r = 0.92
Strong positive
 Find the linear regression equation (round all coefficients to the nearest integer).
y = 11x + 64
How do you find the linear regression line after inputting data?
Menu
Statistics 4
Stat Calculations 1
Linear Regression (mx + b)
Plug in m and b into y = mx + b
There are 300 shapes. 3/4 of them are stars. Of the rhombuses, 60 are red. Of the stars, 80% are yellow. Complete the two-way table
60 45 105
15 180 195
75 225 300
Sketch a scatter plot that represents the amount of time a student studies (x) and the grade on their test (y)

Define a causal relationship
When one variable directly influences or causes a change in another variable.
Data is collected about how average rainfall per month (x), in inches, affects jacket sales for that month (y).
The linear regression line is y = 12x + 27
What does 12 represent in this situation?
For each additional inch of rain, there are 12 more jackets sold.
Connecticut