Locating a Number
Placing a Number
Finding a Number
Finding a Percentage
Line of Best Fit and Scatter Plots
100
What is the total number of individuals who took this survey?
100 students
100
Place the Number: 200 students participated in the survey.

I
100
Solve for A:

12
100
What percentage of students have no curfew?

29%
100
A line of best fit should be drawn....
a) In the middle of the data with half above and half below the straight line
b) Connecting each data point by passing through each point
c) Following a non-linear pattern
d) Wherever I feel like it
a) In the middle of the data with half above and half below the straight line
200
How many High School students have Breakfast?
22 students
200
48 girls play an instrument.

D
200
Solve for B:
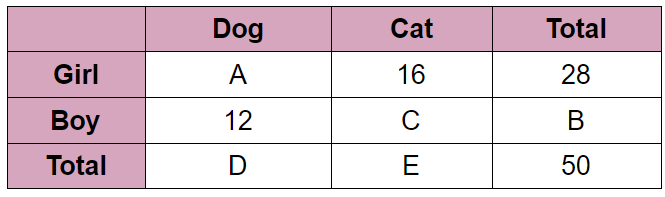
22
200
What percentage of students are on the Honor Roll?
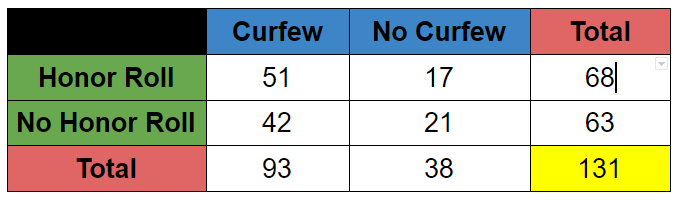
51%
200
A line of best fit has a positive slope. What does this mean?
a) As x increases, y increases.
b) As x decreases, y increases.
c) As x increases, y decreases.
a) As x increases, y increases.
300
What is the total amount of students who Don't Eat Breakfast?
40 students.
300
A total of 110 students doesn't play an instrument.

H
300
Solve for C:
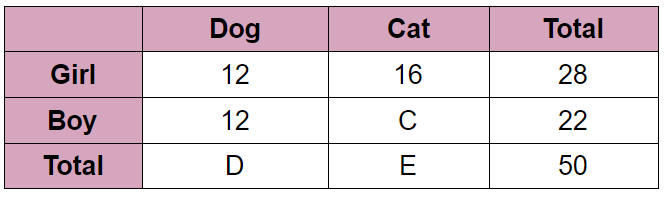
10
300
How many students have a curfew and are not on the honor roll?

32%
300
What type of correlation would expect a comparison of someone's math grade to their height to have?
No Correlation
400
How many Elementary students participated in the survey?
50 students
400
70 boys do not play an instrument.

B
400
Solve for D:

24
400
What percentage of students have a curfew?

70%
400
As x increases, y decreases describes what type of association?
Negative Association
500
How many elementary students don't eat breakfast and how many high school students don't eat breakfast?
12 elementary students and 28 high school students.
500
112 total boys took the survey.
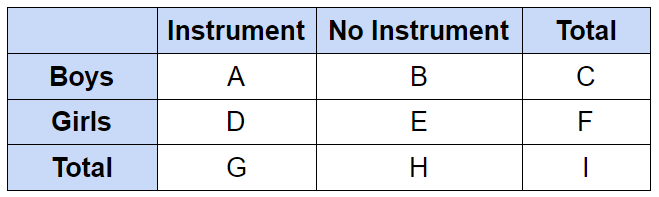
C
500
Solve for E:

26
500
What percentage of students who are on the honor roll do not have a curfew?

25%
500
A line of best fit is mostly used to....
Make predictions