Definitions
Dot Plots
Graphs
Types of data
Bar Graph
100
What is primary data
Observed or collected from 1st hand experience
100
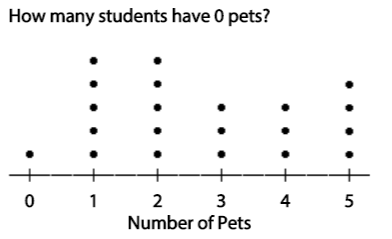
What is used on a dot plot to represent data
Dots
100
A line graph shows a change over .......?
time
100
Give an example of categorical data?
colour, brand, car make etc
100
A bar graph represents data using only horizontal bars: True or False
False: Bars can be horizontal or vertical
200
This is found on a pictograph and tells us how many each picture stands for
A Key
200
1
200
Line graphs are made by connecting a series of ....?
Dots
200
What is the difference between a sample and a census?
Census surveys the whole population but the sample survey part of the population.
200
How many people voted in the survey about favorite colors?
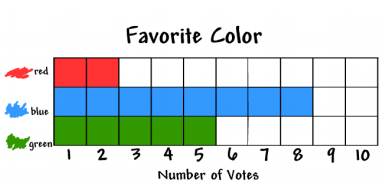
15
300
A collection of facts, such as numbers, words, measurements or observations that is organised on a table
Data
300
5
300
How many grey and black seashells are there?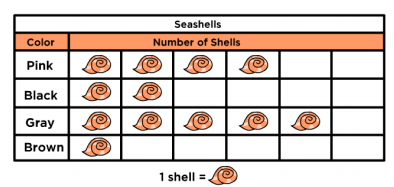
7
300
What is secondary data?
It is collected from other parties.
300
Which camp activity is the most popular
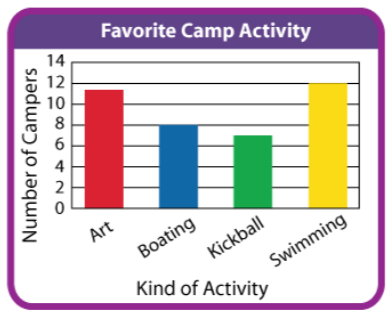
swimming
400
A graph that records each piece of data on a number line
Dot Plot
400
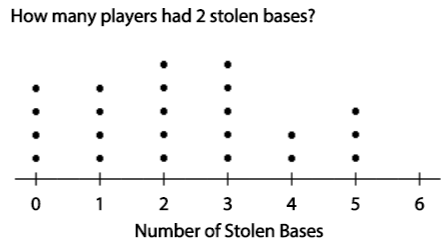
How many people were surveyed?

23
400
How many apples were sold in January and February combined?

50
400
Give two examples of numerical continuous data
Temperature, weight, length
400
Which soccer players scored the least points
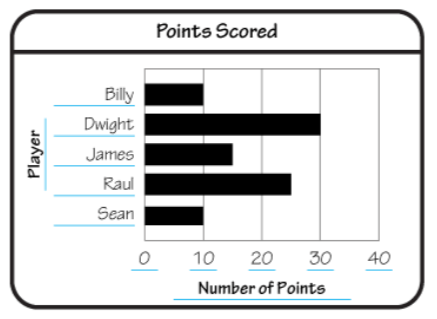
Billy and Sean both scored only 10 points
500
This type of graph can be vertical or horizontal
bar graphs
500
Compare the two dot plots 
They are the opposite to each other.
Most people surveyed exercise less than 4 hours while play video games for more than 6 hours.
500
If 800 people were surveyed, how many said that sausage pizzas were their favourite?
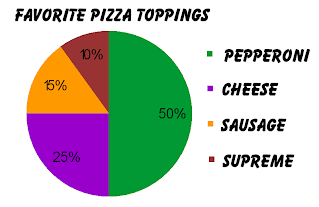
120
500
What is the difference between numerical discrete data and numerical continuous data
Numerical discrete data can be counted while numerical continuous data can be measured.
500
People ANALYZE data in bar graphs to draw conclusions and make comparisons. What does ANALYZE mean
To study closely