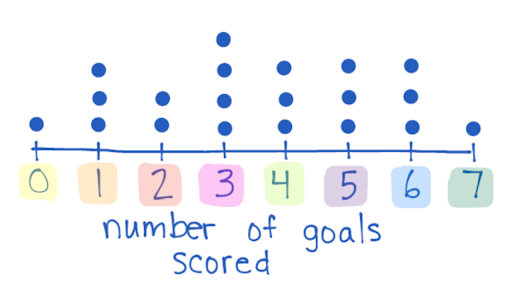
How many players scored 2 goals?
2 soccer players
What is the stem of the following number? 18
1
What is one characteristic of a histogram?
What is the most popular movie genre?
Romance
What does mode mean?
The number that occurs most often
What is the Data set for the Box Plot Below:
0, 1, 1, 1, 2, 2, 3, 3, 3, 3, 4, 4, 4, 5, 5, 5, 6, 6, 6, 7
What is the leaf of the number 96?
6
For a histogram, the RANGES are always on which axis?
X-Axis
How many people like comedy?
4
Calculate the mean of the data set:
33, 38, 35, 39, 31
35.2
What is the Range of the Dot Plot below:
7
What is the MODE of the stem and leaf plot below: 
35 and 41
For a histogram, the FREQUENCYS are always on which axis?
Y-Axis
How many more people liked Romance over drama?
5
Calculate the range and mode of the data set:
625, 625, 619, 619, 677, 638, 659
Range - 58
Mode - 619 & 615
What is the MODE for the data set below:
3
What is the RANGE of the stem and leaf plot below: 
48
Which range has the highest frequency?
50-60
What is the mode of the graph?
Romance
Calculate the mean, range, median of the data set:
65, 76, 91, 24, 88
Range - 67
Mean - 68.8
Median - 76
What is the MEDIAN of the Dot Plot below:
3.5
Make a stem and leaf plot of the following data set:
10, 13, 16, 21, 26, 27, 28, 35, 35, 36, 41, 41, 45, 46, 49, 50, 53, 56, 58

How many people on this graph are 40 to 60 years old?
9 people
What is the mode?

4
What is the mean and median?
28, 36, 44, 59, 66, 71, 108
Median 59
Mean 58.86

