Dot Plots
Data
Histograms
Box Plots
Stats
100
What does one dot represent on the Dot Plot below:
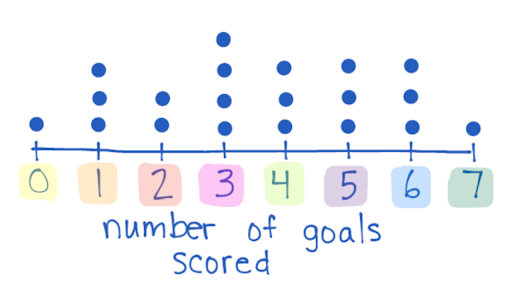
A soccer players number of goals scored
100
How do you find mean?
Mean is the average of data. You add all the data and divide by how many pieces you have.
100
When the bars on the histogram are equal on both sides from the middle this is called....
symmetric
100
What does the number on the far left represent?
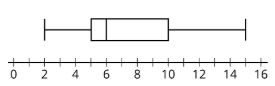
The Minimum or the Lowest Value
100
What are the key words when finding measure of center (mean)?
Summary and typical
200
What is the Data set for the Box Plot Below:
0, 1, 1, 1, 2, 2, 3, 3, 3, 3, 4, 4, 4, 5, 5, 5, 6, 6, 6, 7
200
How do you find the range of the data?
You subtract the highest and lowest data values.
200
When the data on a histogram are high on the left and low on the right, this is called....
skewed right
200
How do you find IQR?
If you have data only, you put it in order, find your low and high groups, find the middle of each group which is Q1 and Q3, then subtract Q3 and Q1.
If you have a box plot, you subtract the values on the edge of the box Q1 and Q3.
200
When distinguishing a statistical question what do you look for?
variability
300
What is the Range of the Dot Plot below:
7
300
What is the MODE of the stem and leaf plot below: 
35 and 41
300
For a histogram, the FREQUENCYS are always on which axis?
Y-Axis
300
What is the RANGE of the Box Plot below:
13
300
When you have symmetrical data what measure of center (mean of median) and variability (MAD or IQR) do you use?
MEAN AND MAD
400
What is the MODE for the data set below:
3
400
What is the RANGE of the stem and leaf plot below:
48
400
True or False:
a histogram tells you specific information about the data
False. It only gives you groups or intervals of data.
400
What is the IQR of the box plot below:
5
400
How do you find the mode of data?
the most often value
500
What is the MEDIAN of the Dot Plot below:
3.5
500
What is the MEDIAN of the stem and leaf plot below:
35
500
How many people on this graph are 40 to 60 years old?
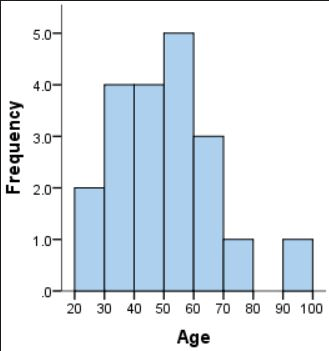
9 people
500
What are the five important pieces of information you must find in order to create a box and whisker plot?
-Minimum
-Q1
-Median (Q2)
-Q3
-Maximum
500
Is this a statistical question to ask your class? "How many books have the students read in your class?"
yes