Dot Plots
Histograms
Box Plots
Fun Facts
Mean Median Mode
100
What does one dot represent on the Dot Plot below:
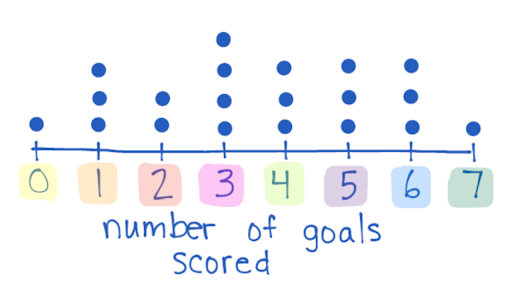
A soccer players number of goals scored
100
true or false:
In a histogram the numerical information is always grouped in intervals
true
100
What does the number on the far left represent?
The Minimum or the Lowest Value
100
What pet does your math teacher have?
dog
100
The mode of the data set is
19, 20, 0, 18, 3, 7
none (not zero)
200
What is the Data set for the Box Plot Below:
0, 1, 1, 1, 2, 2, 3, 3, 3, 3, 4, 4, 4, 5, 5, 5, 6, 6, 6, 7
200
For a histogram, the INTERVALS are always on which axis?
X-Axis
200
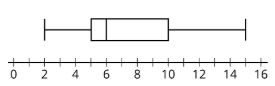
What data point on the box and whisker plot marks Q3?
10
200
The very first video game was "Tennis for Two" in what year?
1958
200
the mode of the data set is :
0, 9, 8, 3, 2, 1, 1,2,
1 and 2 (a tie)
300
What is the MODE for the data set below:
3
300
True or False:
a histogram tells you specific information about the data
False
300
What is the IQR of the box plot below:
5
300
Where does your math teacher live?
Sussex
300
The median is :
3, 6, 8, 1, 4, 2, 9,
4
400
What is the Range of the Dot Plot below:
7
400
For a histogram, the FREQUENCYS are always on which axis?
Y-Axis
400
What is the RANGE of the Box Plot below:
13
400
Originally, Amazon only sold what kind of product?
Books!
400
The mean is:
23, 16, 17, 19, 34, 7, 9
17.85 (rounded to the hundredth)
500
What is the MEDIAN of the Dot Plot below:
3.5
500
How many people on this graph are 40 to 60 years old?
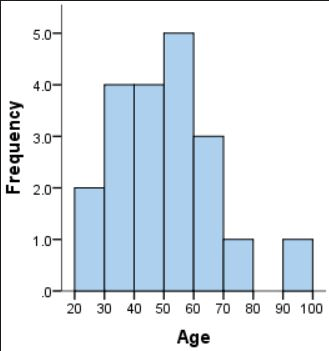
9 people
500
What are the five important pieces of information you must find in order to create a box and whisker plot?
-Minimum
-Q1
-Median (Q2)
-Q3
-Maximum
500
How many people have walked on the moon?
12
500
The mean is 22, what is the MAD?
31,12, 22,5, 30
9.2