Dot Plots
MMMR
Histograms
Box Plots
Vocabulary
100
What does one dot represent on the Dot Plot below:
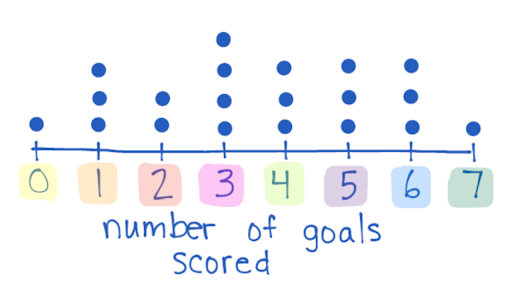
A soccer players number of goals scored
100
When finding the median what is the first step I need to do with my data set?
Put the numbers in order from least to greatest.
100
true or false:
In a histogram the numerical information is always grouped in intervals
true
100
What does the number on the far left represent?
The Minimum or the Lowest Value
100
The middle number of the data set.
Median
200
What is the Data set for the Box Plot Below:
0, 1, 1, 1, 2, 2, 3, 3, 3, 3, 4, 4, 4, 5, 5, 5, 6, 6, 6, 7
200
What are the correct steps when finding the mean?
Count how many values I have
Add all the values together
Divide the total sum by the total values
200
For a histogram, the INTERVALS are always on which axis?
X-Axis
200
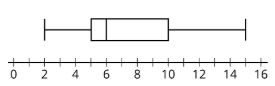
What data point on the box and whisker plot marks Q3?
10
200
The average of the numbers in a data set.
Mean
300
What is the Range of the Dot Plot below:
7
300
Find the median of 3,5,7,4,1,0,6,8
4.5
300
For a histogram, the FREQUENCYS are always on which axis?
Y-Axis
300
What is the RANGE of the Box Plot below:
13
300
After locating the minimum and maximum I subtract to find this?
Range
400
What is the MODE for the data set below:
3
400
Find the mean of 10,9,7,5,11,2,4
8
400
True or False:
a histogram tells you specific information about the data
False
400
What is the IQR of the box plot below:
5
400
After finding the median of both the upper half and lower half I subtract them to find this?
IQR - Interquartile Range
500
What is the MEDIAN of the Dot Plot below:
3.5
500
What is the range for the following set of data?
4, 15, 2, 4, 6, 20
18
500
How many people on this graph are 40 to 60 years old?
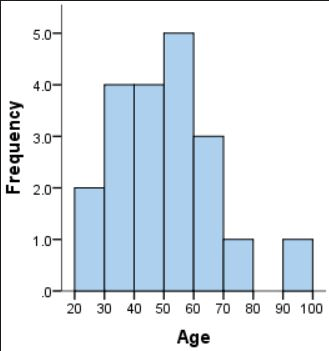
9 people
500
What are the five important pieces of information you must find in order to create a box and whisker plot?
-Minimum
-Q1
-Median (Q2)
-Q3
-Maximum
500
The number that shows up the most frequently in a data set is called:
Mode