Science and the Scientific Method
Experiments
Characteristics of Graphs
Types of Graphs
Miscellaneous
100
This is a testable explanation to a question or problem.
hypothesis
100
This is the variable that is the main subject of the experiment. It is what the scientist is investigating.
independent variable
100
Triple points
When analyzing the data contained in a graph, it's important to look for which two things?
Patterns -- trends or repeated examples of something
Outliers -- data that is far outside of any patterns
100
This type of graph is good for showing exact amounts of something in different categories.
bar graph
100
Triple points
Most of the _______ that humans rely on, such as cars, computers, electric lights and medicines are the product of taking different things learned through the process of ______ and then making something based on that learning.
technology,
science
200
This word refers to the repeating of something in order to make more versions that are better and better. Scientists do this all the time in different ways.
iterate
200
This group is used as a source of comparison in an experiment.
control group
200
What four important labels is this graph missing?
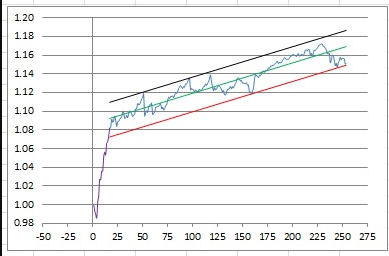
1. No title
2. x-axis unlabeled
3. y-axis unlabeled
4. no key for different lines
200
This type of graph is generally used to show change in a single variable over time.
line graph
200
How many variables should be tested in a single experiment at one time?
one variable
300
Double points
When collecting observations or gathering evidence from experiments, the more ______ that is collected, the better the observation or experiment is likely to be.
data/evidence
300
These variables must be kept the same between the experimental and control groups in an experiment so that they don't affect the results.
controlled variables
300
This is the most commonly forgotten part of a good graph in science. It is the first thing that someone else will look at in order to figure out what the graph is showing.
a descriptive title
300
Double points
Which two types of graph would be best for showing how many students are in each grade at Franklin?
bar graph or pie chart
300
Double points
Identify the two main types of data and provide an example of each.
Qualitative data: blue shirt, unhealthy plant, new microscope, bright star, or any other term that describes something
Quantitative data: 1 experiment, 4 students, 5 bacterial colonies, 33 orangutans or any other numerical amount of something
400
The process of doing science usually begins with two things. What are they?
an observation
a question/problem
400
The group in an experiment that gets the independent variable.
experimental group
400
The ________ variable goes on the x-axis and the __________ variable goes on the y-axis in science graphs.
The independent variable goes on the x-axis and the dependent variable goes on the y-axis in science graphs.
400
This type of graph shows the correlation or relationship between two measured variables.
scatter plot
400
Double points
The process of science is usually not a ______ process that follows a straightforward series of steps, but rather an ______ process that keeps repeating and bouncing around between different steps.
The process of science is usually not a linear process that follows a straightforward series of steps, but rather an iterative process that keeps repeating and bouncing around between different steps.
500
When we studied science, we broke it down into two main parts. What are these two parts?
science is a process or method
science is a collection of knowledge or information
500
This variable refers to the results of an experiment.
dependent variable
500
Both axes in science graphs should have clear ______ that identify what they show, as well as a consistent numbering scale that includes the appropriate ______ so that what they show is clear.
Both axes in science graphs should have clear labels that identify what they show, as well as a consistent numbering scale that includes the appropriate units so that what they show is clear.
500
This type of graph shows the parts of a whole, usually using percentages.
pie chart/graph
500
When using the CER method to answer a question or solve a problem, what is the best order in which to go through the steps of CER?
1. Identify relevant evidence
2. Apply reasoning to evidence
3. Write a claim that answers the question