Foundations of Experimental Design
Variable Identification
Analyzing Data (Graphing)
Metric System & Scientific Notation
Measuring
100
Which format is recommended for writing a hypothesis?
a) What if...?
b) I think that...
c) If...then...because...
d) The experiment will show...
C) If... then...because
100
What is the variable that we purposefully change?
Independent
100
What is the purpose of analyzing data in an experiment?
a) To make sense of the collected information and answer the testable question
b) To create colorful graphs for visual appeal
c) To make the experiment look more professional
d) To prove the original hypothesis was correct
a) To make sense of the collected information and answer the testable question
100
List out the metric prefixes from largest to smallest
Kilo Hecto Deka (Base) Deci Centi Milli
100
How many guess digits do you always record?
1
200
"If the plant receives more sunlight, then the plant will grow faster" is an example of a(n)....
A hypothesis
200
The variables that remain the same the entire time are called….
Controlled variables
200
What axis do the independent and dependent variable go on?
Dependent = y
Independent = x
200
Convert 62.5 L → cL
6250 cL
200
 Record the measurement in mL
36.5 mL
300
Why is it important to perform multiple trials in an experiment?
a) To make the experiment last longer
b) To use up all available materials
c) To confuse other scientists trying to replicate the experiment
d) To increase the reliability of the data
d) To increase the reliability of the data
300
In the question "How does soil pH affect tomato plant growth?", what is the dependent variable?
Tomato Plant Growth
300
Identify what the following graph is missing
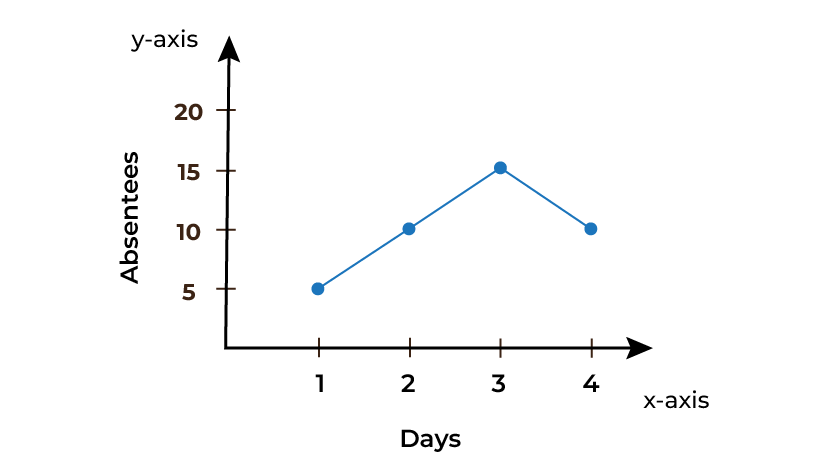
A title
300
Convert 6.3 x 10⁻⁵
0.000063
300
Record the measurement in grams
412.50 g
400
Why is it important that an experiment be repeatable by others?
a) So other scientists can steal your ideas
b) To verify the results and increase scientific validity
c) To waste time and resources
d) To create competition between research teams
b) To verify the results and increase scientific validity
400
Why do we use control groups?
Acts as a baseline
Used for comparison
400
Identify what the following graph is missing

The unit that temperature was measured in
400
Convert 4523000.2 to scientific notation
4.5230002 x 10⁶
400
Record the measurment in cm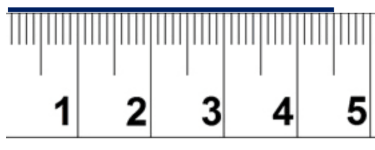
4.50 cm
500
Which of the following is an example of a good testable question?
a) Why does the sun rise in the east?
b) Did the sun rise this morning?
c) How does changing the amount of sunlight affect plant growth?
d) Is the sun important for life on Earth?
c) How does changing the amount of sunlight affect plant growth?
500
Dr. Lewis wants to know if giving teachers candy will make them smile more. He gives half the teachers candy and the other half get nothing. He then records the number of times the teachers smiled.
Identify the experimental & control groups, the idependent & dependent variables, and write a testable question.
100 points each.
Experimental = teachers w/ candy
Control = teachers w/o candy
Independent = candy
Dependent = # of times teachers smile
Testable Question = How does candy effect the number of times a teacher smiles?
500
List the 5 components of a good graph.
100 points per component.
Proper Title
Data on correct axis (Dry Mix)
X and Y axis Labeled w/ Units
Consistent Scale
Accurately Plotted Points
500
Convert 0.015 km → mm
15,000 mm
500
Record the measurement in grams
120.91 g