Vocab 1.1-1.3
Vocab 1.4-1.8
Calculate 1.1-1.3
Calculate/ Explain 1.4-1.8
Miscellaneous
100
The difference between the maximum and minimum values of a data set.
What is the range?
100
One of the four regions that a coordinate plane is divided into by the two axes. Numbered I, II, III, and IV
What is a quadrant?
100
Find the range of this data set:
65, 92, 66, 73, 98, 90, 79, 61, 70, 72
What is 37?
100
Define abscissa.
What is the x-coordinate in an ordered pair?
100

Name the type of graph
What is a pictograph?
200
This term is calculated the same way as the average. It is also a measure of central tendency.
What is the mean of a data set?
200
Intervals on the horizontal axis of a histogram.
What are bins?
200
Find the mean of the data set:
45, 34, 78, 56, 50, 33
Rounded to the second decimal point
What is 49.33?
200
Write as a percent:
22/80
What is 27.5%?
200

Name the type of graph
What is a relative frequency graph?
300
A group of data with the same attribute.
What is a category?
300
On a graph, this line represents the outcomes when each variable (or thing being measured) has the same measurement or changes at the same rate.
What is the line y=x?
300
Find the median of this data set:
65, 92, 66, 73, 98, 90, 79, 61, 70, 72
What is 72.5?
300
How is a histogram different from a normal bar graph? (More than one possible answer)
A histogram uses bins that correspond to an interval of data values.
A histogram has bars that touch and are graphed on a number line.
A bar graph uses categories (qualitative data) while histograms uses a number line to graph numerical values (quantitative data)
300
The number of times a value appears in a data set.
What is frequency?
400
The mean median and mode are all.....
What is a measure of central tendency?
400
A collection of data that measures two traits or quantities.
What is two-variable data?
400
Find the Variance of the data set if the Standard Deviation is 24
What is 256?
400
Write the interval as an error:
Between 20 and 250
What is 135±115?
400
The definition of joint frequency
What is the value in each cell of a two-way frequency table?
500
A data display that shows the five number summary of a data set.
What is a box plot?
500
A relationship that you can represent with a straight line graph.
What is a linear relationship?
500
Find the standard deviation of the data set:
65,92,66,73
What is 12.52?
500
What is the difference between relative frequency and frequency?
Frequency describes how often a value appears in a data set
Relative frequency is a ratio that compares how many times an outcome occurred to the data total
500
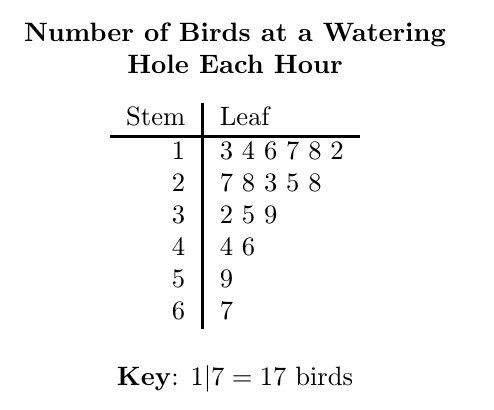
What is wrong with this plot?
The leaves are not in numerical order