Vocab 1.1-1.3
Vocab 1.4-1.8
Calculate 1.1-1.3
Calculate/ Explain 1.4-1.8
Miscellaneous
Data Displays
100
The difference between the maximum and minimum values of a data set.
What is the range?
100
One of the four regions that a coordinate plane is divided into by the two axes. Numbered I, II, III, and IV
What is a quadrant?
100
Find the range of this data set:
65, 92, 66, 73, 98, 90, 79, 61, 70, 72
What is 37?
100
Define abscissa.
What is the x-coordinate in an ordered pair?
100
A number's distance from 0 on a number line.
What is absolute value?
100
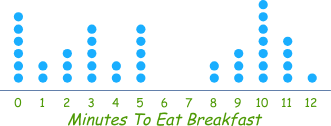
What is a dot plot?
200
This term is calculated the same way as the average. It is also a measure of central tendency.
What is the mean of a data set?
200
Intervals on the horizontal axis of a histogram.
What are bins?
200
Find the mean of the data set:
45, 34, 78, 56, 50, 33
Rounded to the second decimal point
What is 49.33?
200
Write as a percent:
22/80
What is 27.5%?
200
The number of times a value appears in a data set.
What is frequency?
200

Name the type of graph
What is a pictograph?
300
A group of data with the same attribute.
What is a category?
300
On a graph, this line represents the outcomes when each variable (or thing being measured) has the same measurement or changes at the same rate.
What is the line y=x?
300
Find the median of this data set:
65, 92, 66, 73, 98, 90, 79, 61, 70, 72
What is 72.5?
300
How is a histogram different from a normal bar graph? (More than one possible answer)
A histogram uses bins that correspond to an interval of data values.
A histogram has bars that touch and are graphed on a number line.
A bar graph uses categories (qualitative data) while histograms uses a number line to graph numerical values (quantitative data)
300
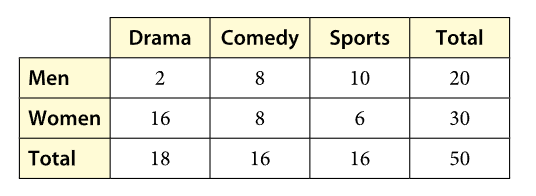
What percent of the people surveyed were men? What kind of frequency is this?
40% - Marginal Relative Frequency
300
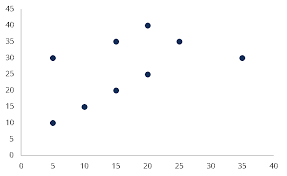
What is a scatterplot?
400
The mean median and mode are all.....
What is a measure of central tendency?
400
A collection of data that measures two traits or quantities.
What is two-variable data?
400
Find the Variance of the data set if the Standard Deviation is 24
What is 576?
400
Write the interval as an error:
Between 20 and 250
What is 135±115?
400
The definition of joint frequency
What is the value in each cell of a two-way frequency table?
400

Name the type of graph
What is a relative frequency graph?
500
A data display that shows the five number summary of a data set.
What is a box plot?
500
A relationship that you can represent with a straight line graph.
What is a linear relationship?
500
Find the standard deviation of the data set:
65,92,66,73
What is 12.52?
500
What is the difference between relative frequency and frequency?
Frequency describes how often a value appears in a data set
Relative frequency is a ratio that compares how many times an outcome occurred to the data total
500
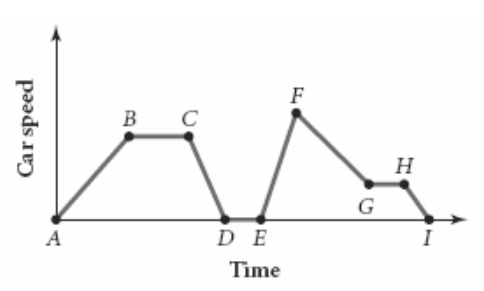 The image shows the speed of the car driven by a mother taking her children to school. Write a brief story about the drive to school. Your story should account for each segment in the graph.
The mother started at point A and she sped up until reaching the speed limit at point B. She was right at the speed limit until point C when she began to slow down until she reached the stop light at point D. At point E, the light turned green and she began to accelerate. The speed limit decreased at Point F and she slowed down until she reached the speed limit at point G. She kept the same speed until point H. She slowed down to park and reached her destination at point I.
500
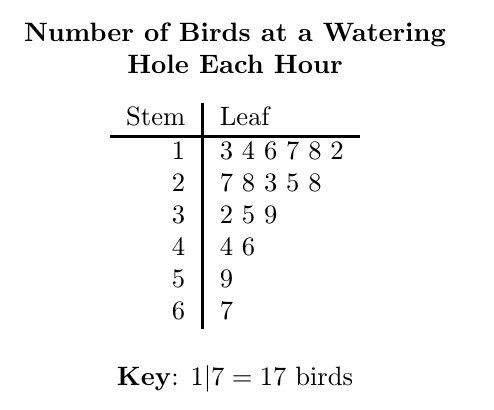
What is wrong with this plot?
The leaves are not in numerical order