Draw an example of a scatter plot that could be described as a Strong, Negative, Non-linear association.
Student responses*
What is Mr. Lopez's brother's name?
Joshua
Input: x = -4
Machine: f(x) = -2x + 4
Output: f(-4) =
12
Fig. 1=5 tiles, Fig. 2=8 tiles Fig. 3=11 tiles
What would the equation for this tile pattern be in Slope-intercept form?
y = 3x +2
In: 3, 6, 9 , 12, 15
Out: 2, 4, 6, 2, 4
Is this a function?
Yes! Every input has exactly one output.
Draw an example of a scatter plot that could be described as a Weak, negative association with clusters
Student responses*
What band released the hit album Nevermind in the 90's.
Nirvana
Input:x=2
Machine: f(x) = 3 x 9x
Output: f(2) =
243
Calculate the slope with these two points on the line.
(-3, -2) and (3, 10)
Slope = 2
No it is not a function.
Describe the association of data below:
Moderate, positive, linear association
This Washington native was the original host of the show The Price is Right.
Bob Barker
Input: x = 4
Machine: f(x) = 0.5 x 3x
Output: f(4) =
40.5
Find the y-intercept of the line with a slope of 3/2 that goes through point (-12, -21)
y-int. = -3
Simplify the expression below:
28x6/35x3
4/5x3
Which graph has a moderate, negative association?
Graph 4
What city in Washington state has the largest building in the world?
Everett Wa
Input : x = ?
Machine: f(x) = x2 - 1
Output: f(x) = 143
12 or -12
The y-axis of a graph is labeled "Gallons of gas" the x axis is labeled "Miles". What would the point (75, 3) mean in the context of this graph?
The car drove 75 miles on 3 gallons of gas.
Write the following number in scientific notation:
600,000,000,000,000,000,000,000,000,000
6 x 1029
Give me a real world example of a graph that would have a strong, positive, linear association.
*Student responses*
What city is Washington State University located in?
Pullman
Input: x = ?
Machine: x + 3/2x - 5
Output: f(x) = 7.5
5
Solve for the slope, then y-intercept. Then write the equation for the line in Slope-Intercept form.
y = 9x + 0 or y = 9x
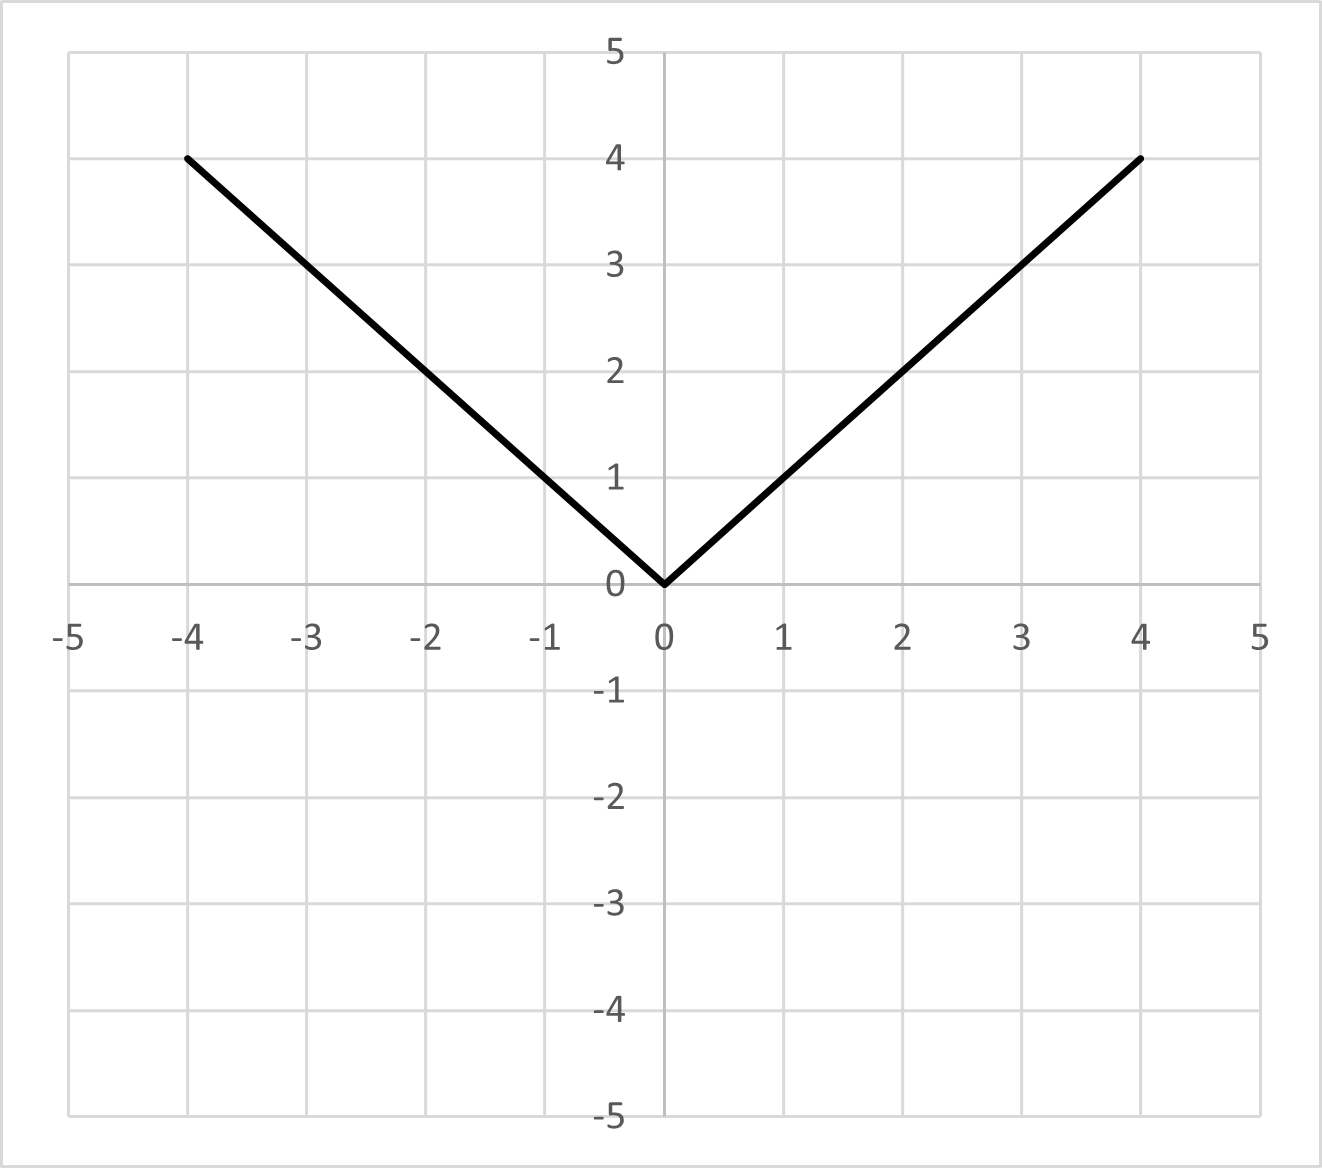
What is the domain and range of the graph below. Pretend there are arrows on the end of the line.

Domain: All Real Numbers
Range: y > 0