SOCV
Pro Tips
Measures of Center/Spread
Two-Way Tables
Potluck
100
The direction of this skew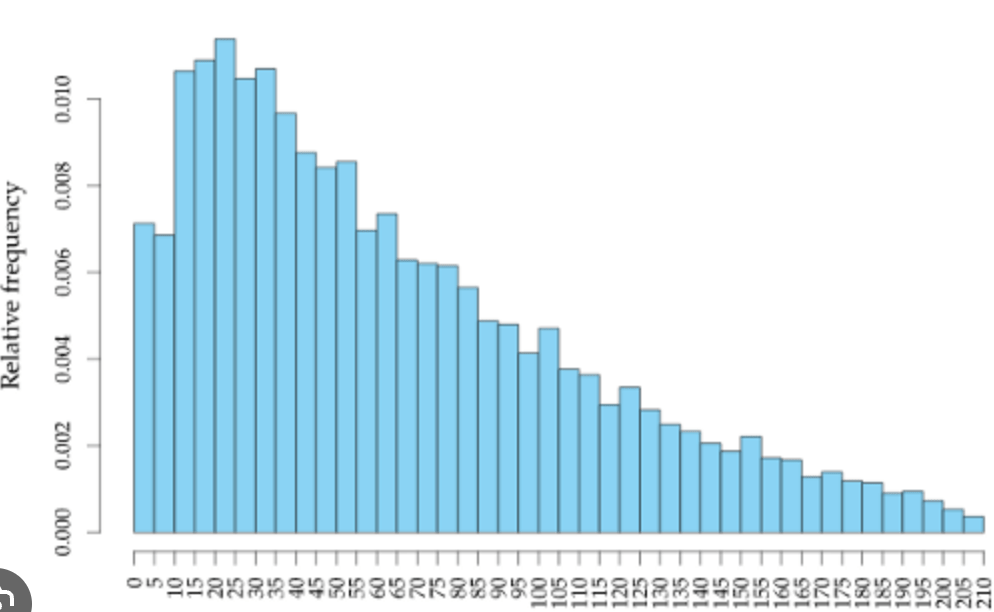
Right
100
You enter data in Desmos. And create a table with writing "table". This is the function in Desmos that will tell you all the summary statistics you'll need.
stats()
100
A dotplot's shape if \bar{x}>median
Anything skew right
100
The following two-way table displays data for the 219 students who responded to a survey.
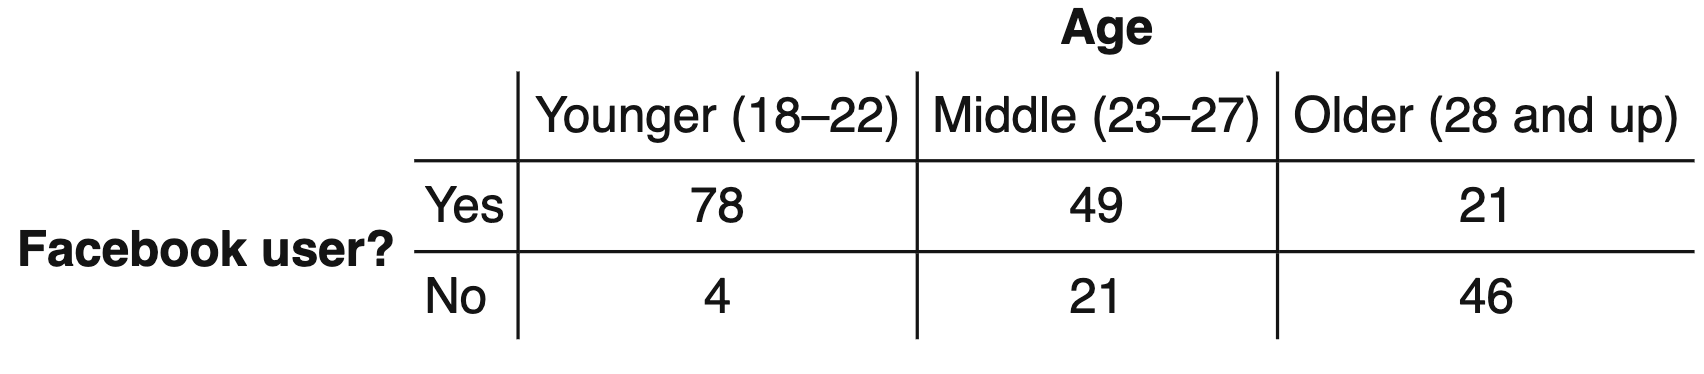
What percent of the students who responded were Facebook users? (Give Fraction)
\frac{148}{219}=0.6758
100
It's the year this picture was taken. It's also the same year the first Iron Man movie came out.

2008
200
The name of this unusual feature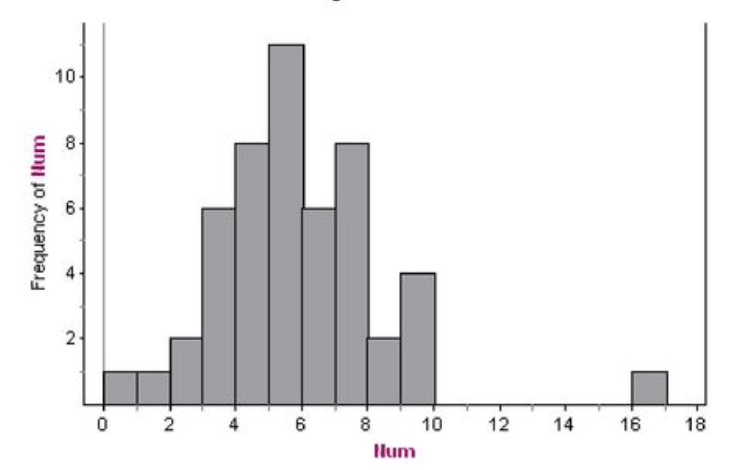
Gap (Outlier)
200
Easiest way to earn 0 credit for a question
Leave it blank
200
Use this measure of spread for this histogram showing the number of servings of fuit per day for a sample of 74 teenagers.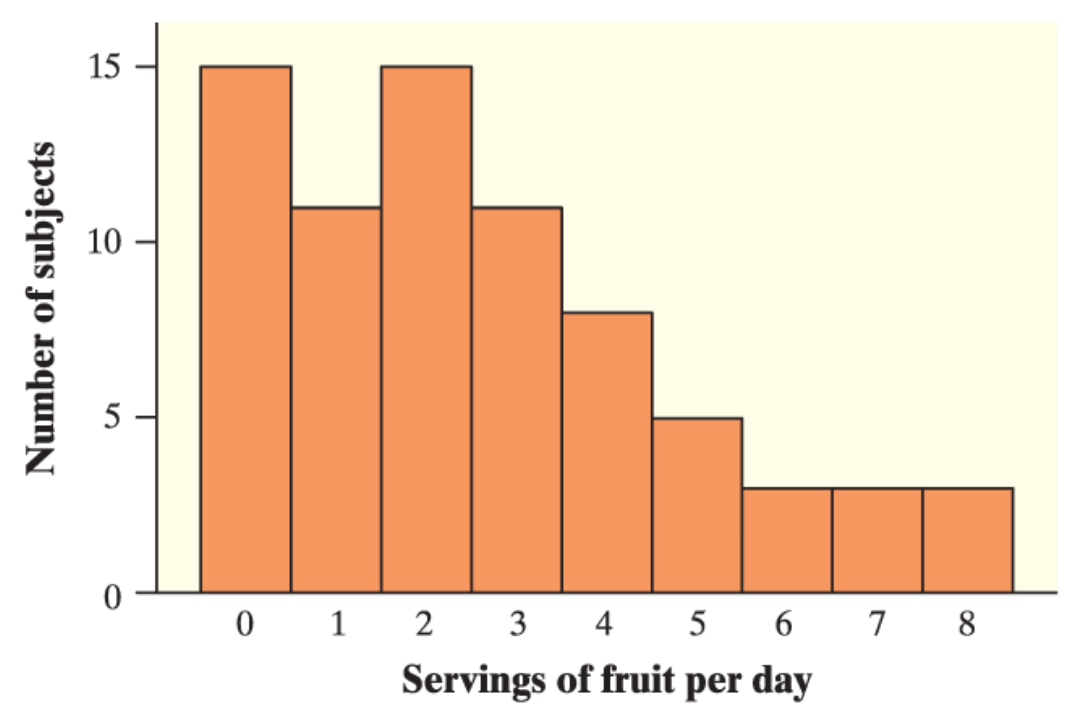
IQR! (Or Range)
200
How many variables are represented in this two way table?
2! (Age range and if they are a facebook user)
Age range can take on 3 values(Younger/Middle/Older) and facebook user can take on two (Yes/No)
200
Catherine and Ana suspect that athletes typically have a faster reaction time than other students. To test this theory, they gave an online reflex test to separate random samples of 33 varsity athletes and 29 other students at their school.
Are these numerical summaries statistics or parameters?
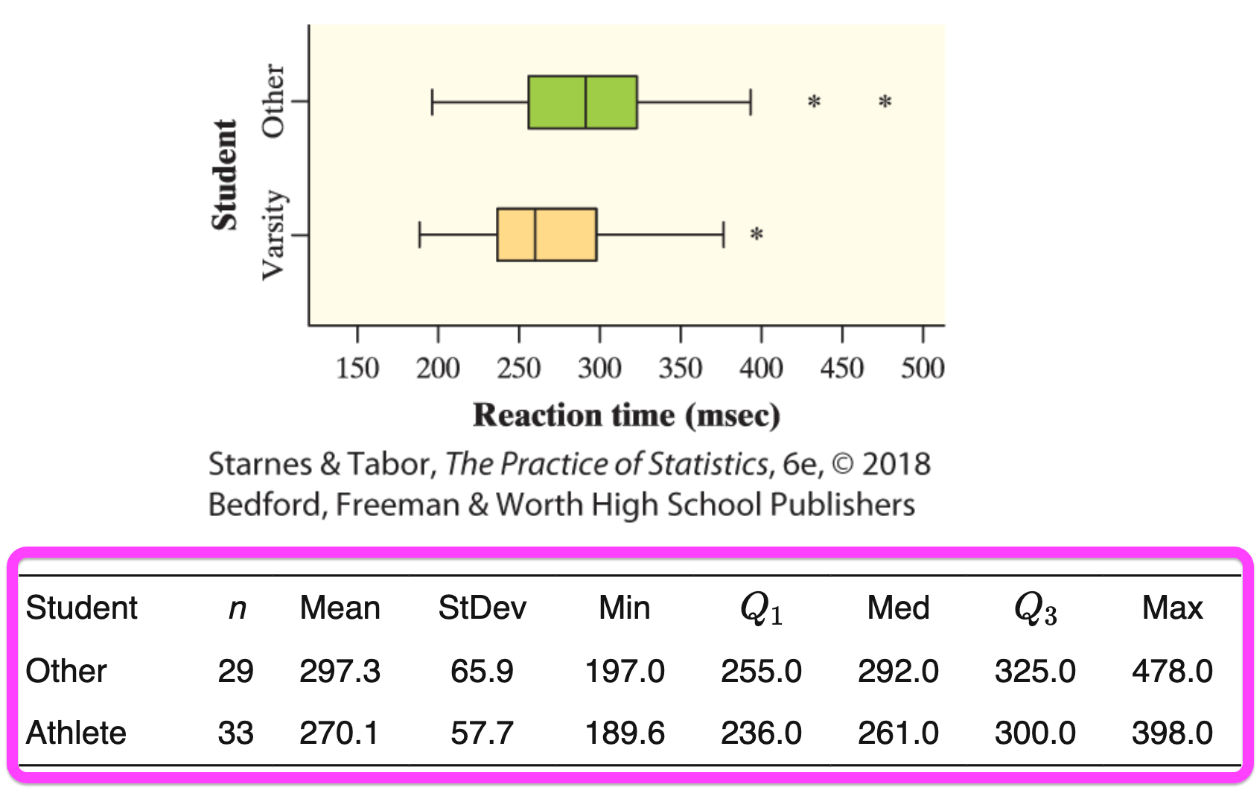
Statistics!
300
Describe the distribution of highway fuel economy ratings for a sample of 2018 Toyota 4 Runners.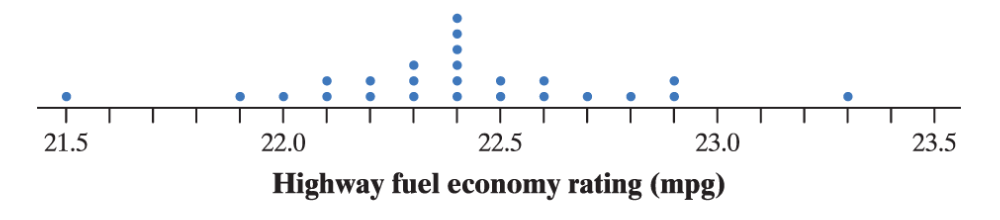
---The distribution of highway fuel economy ratings is roughly symmetric, with a single peak at 22.4 mpg. There are two clear gaps: between 21.5 and 21.9 mpg and between 22.9 and 23.3 mpg.
---The cars with 21.5 mpg and 23.3 mpg ratings are possible outliers.
---The mean rating is about 22.4 mpg.
---The ratings vary from 21.5 to 23.3 mpg.
300
If you're not sure if something is an outlier and you are asked to describe a distribution. These types of words are your friend
Approximate, Estimating, Potential (Etc...)
300
The data show the number of close friends reported from a sample of 11 students. The mean is 3 and the standard deviation is 1.34 close friends. (Interpret the standard deviation)
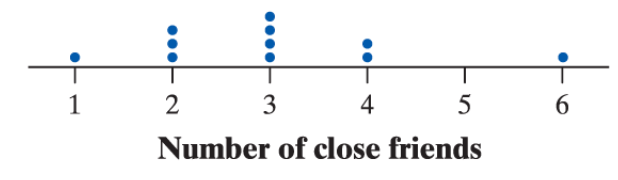
The number of close friends for these 11 students typically varies from 3 by about 1.34 friends.
300
Is there an association? (Justify your answer)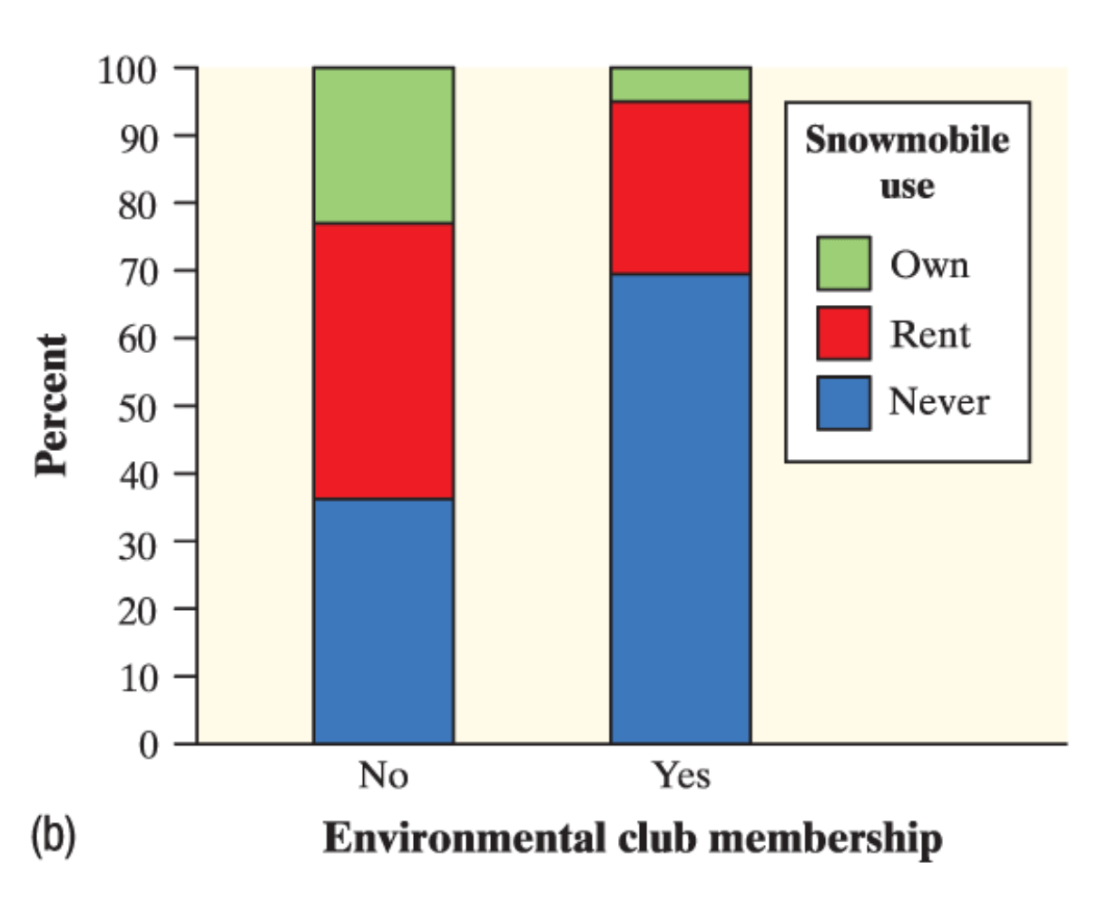
Yes! Students that are not in the environmental club are more likely to own a snowmobile.
300
The following bar graph shows the distribution of favorite subject for a sample of 1000 students. What is the most serious problem with the graph?
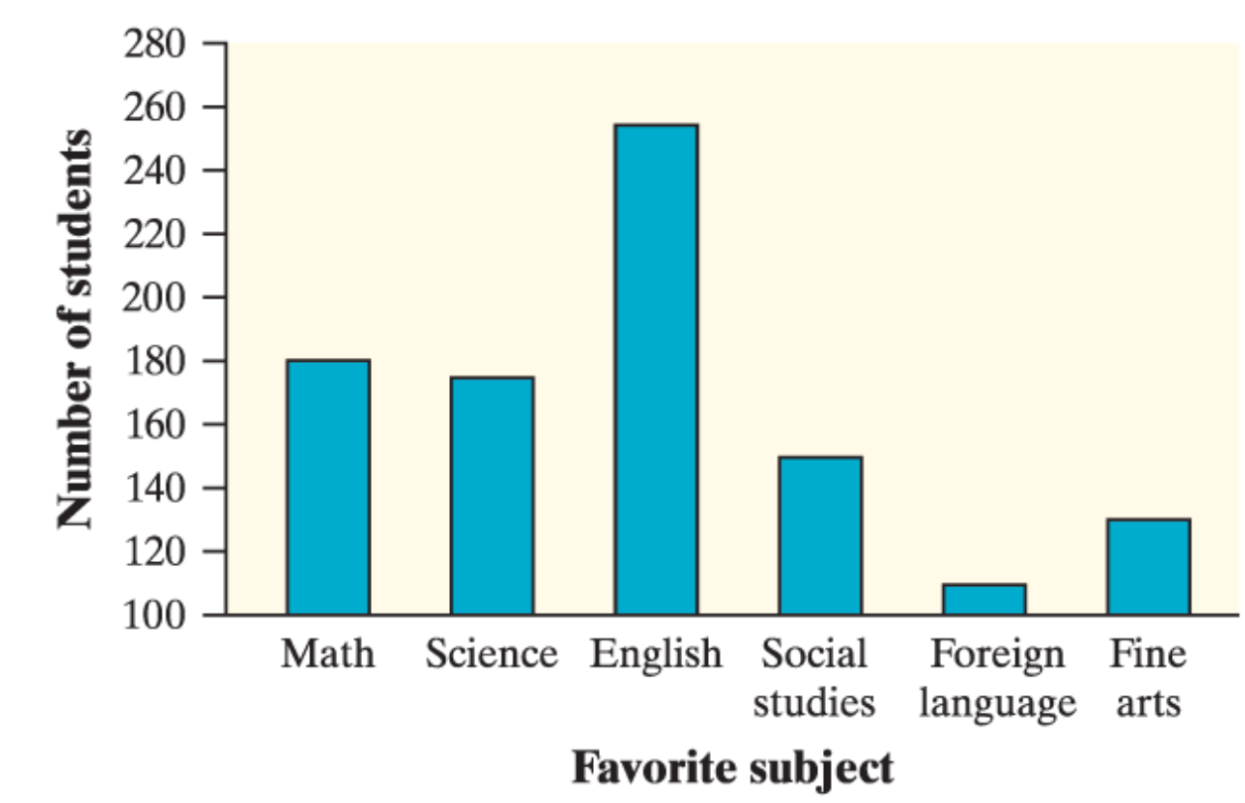
The vertical axis should start at 0 rather than 100! (Truncation)
400
The image shows a back-to-back stemplots of 19 middle school students’ resting pulse rates and their pulse rates after 5 minutes of running. Compare shapes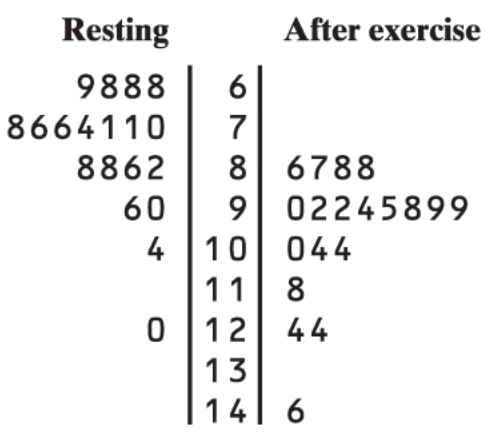
The distributions of resting and after exercise pulse rates for these middle schoolers have the same shape of skew right.
400
With the SOCV acronym you will receive at most partial credit for not including this...
Context!!! Context!!! Context!!! Context!!! Context!!! Context!!! Context!!! Context!!! Context!!! Context!!! Context!!! Context!!! Context!!! Context!!! Context!!! Context!!! Context!!! Context!!! Context!!! Context!!! Context!!! Context!!! Context!!! Context!!! Context!!! Context!!! Context!!! Context!!! Context!!! Context!!! Context!!! Context!!! Context!!! Context!!! Context!!! Context!!! Context!!! Context!!! Context!!! Context!!!
400
Explain the point (purpose) of the random salary demonstration in class
To show how the mean is not a resistant measure of center and should not be used if outliers/skew are present in a distribution.
400
The following two-way table displays data for the 219 students who responded to a survey.
What percent of the Facebook users in the sample were younger students? (Give Fraction)
\frac{78}{148}\approx0.527
400
For the past 14 years, Mr. French is also a professional one of these.
Easter Bunny!
500
What is missing or weak in this description. 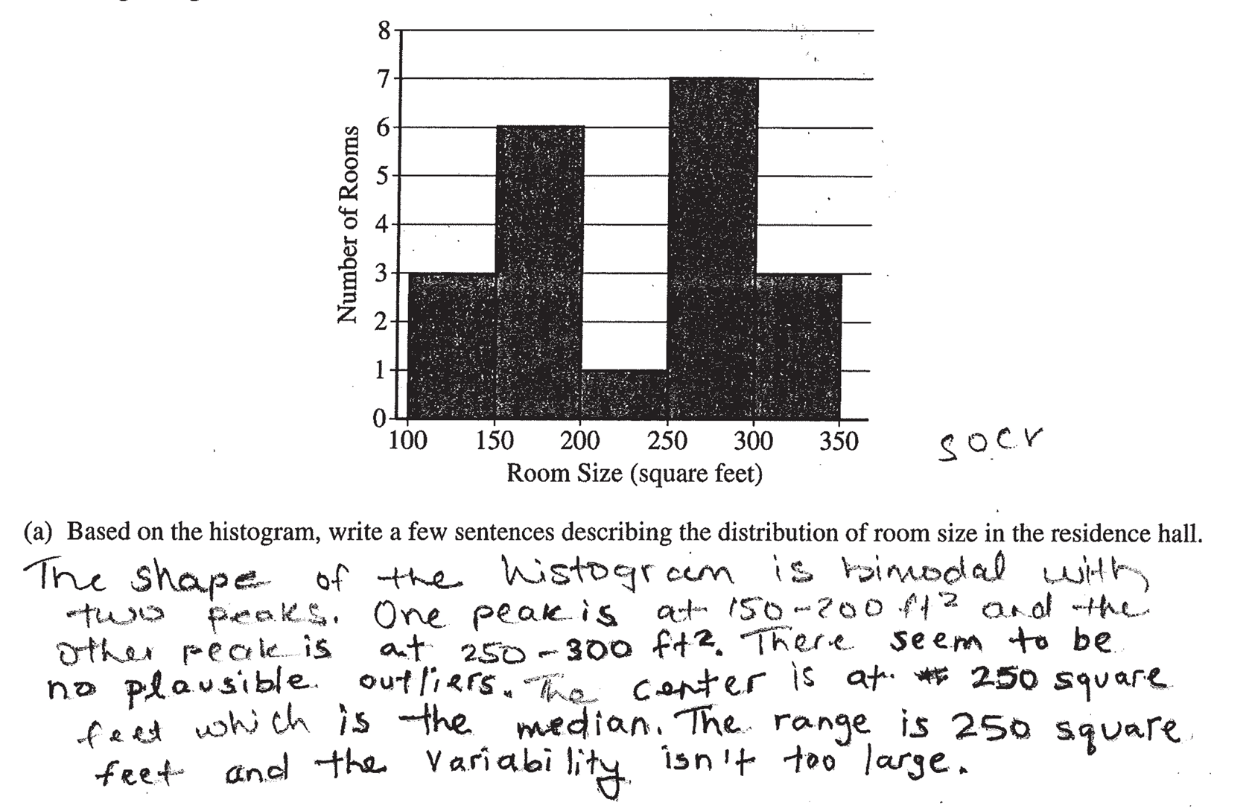
Variability is wrong, (don't know range)
Missing solid context (units are included though)
Center is wrong, (don't have data)
500
This is the type of language you should use when comparing distributions. Give an example.
Comparative!
More than, less than, the same as etc....
500
Why is standard deviation never negative?
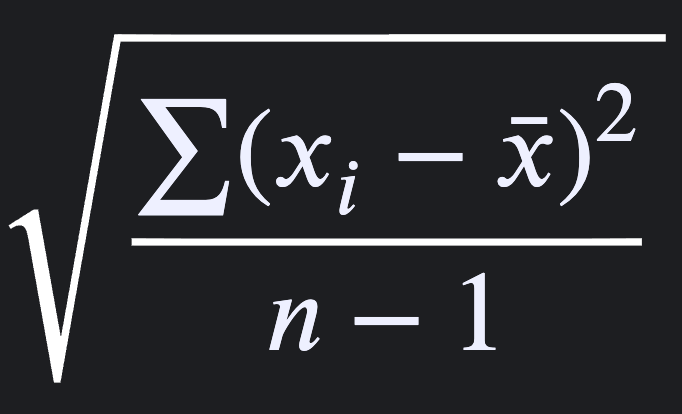
The squaring make the deviations positive! And it is measuring a typical distance from the mean, so it must be positive.
500
If there is no association between gender and handedness for the members of the sample, find the value of x?
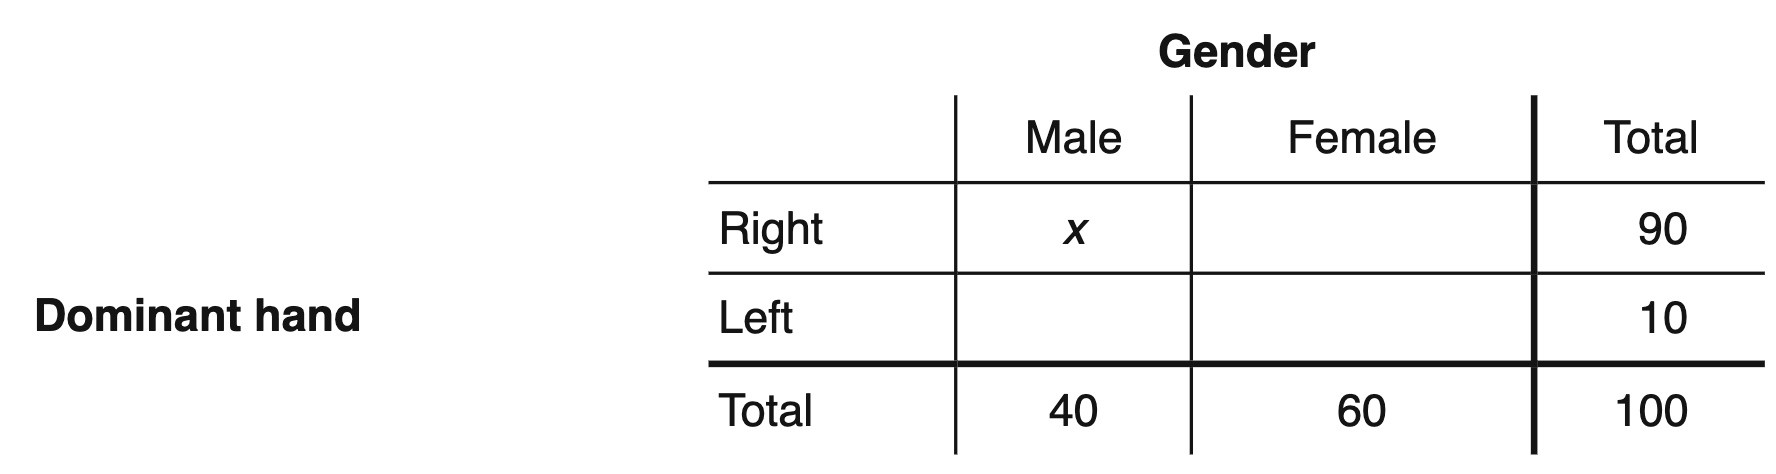
36! The proportion of 90:10 should match for both Male and Female! and 36 is 90% of 40.
500
Which of the following could be the median age? (Note, there is a total of 52 in the data set)
19. 24. 29. 34. 39
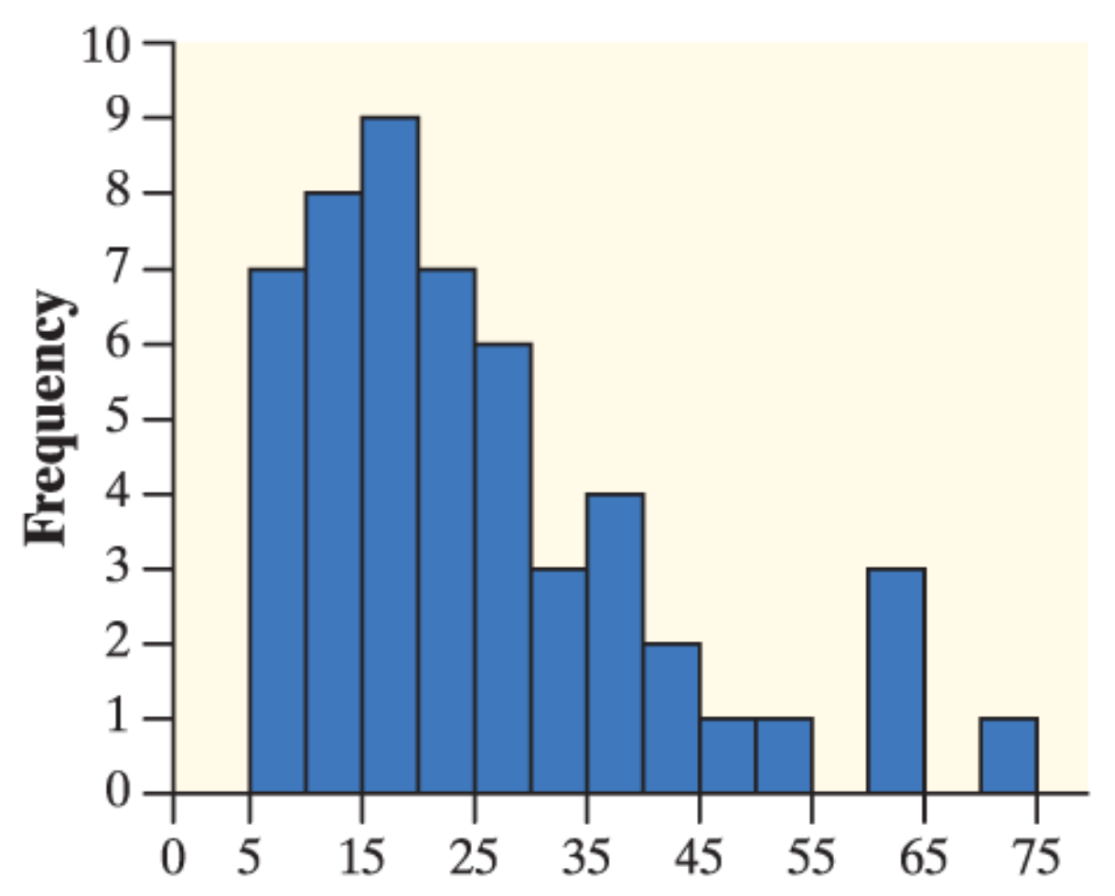
24!
There are 52 total if you add the heights of the bars. The median is the 1/2 mark. So half of 52 is 26.
This cannot be in the first three bars, but would be in the fourth bar. 24 is the only option that is in that particular bar.