Vocab
Metric Conversions
Graphing and stuff
Scientific Method
Randoms
100
a method for studying the natural world by gaining knowledge through observations and investigations.
science
100
Convert 1.23 m to mm
1230 mm
100
What is the name of the label on the TOP of a graph?
Title
100
What is the 1st step in the scientific method?
Ask a question
100

Do males or females better prefer chocolate?
Females
200
Something that remains the same between the control group and the experimental group
Constant
200
Convert 250 L to kL
0.250 kL
200
This type of graph shows only percentages and compares it to the whole sample
Circle graph/pie chart/pie graph/yummy pie is good
200
a testable prediction that attempts to answer a question; an educated guess
Hypothesis
200

What is the most favorite type of movie?
Romance
300
objective; based on the 5 senses, not opinion.
Ex. The ground is wet.
Observation
300
Covert 0.025 DaL to mL
2500 mL
300
The independent variable is graphed on this axis.
X-axis
300
What is Qualitative data? Give an example
word description. Ex: color
300
How would your explain to someone how to find the AVERAGE in a data set?
Add up all of the observations and divide by the total of observations
400
an explanation, based on evidence, of why things happen.
Theory
400
Convert 12,000,000 miligrams to kilograms
12 kg
400
The variable that changes in response to what was changed in the experiment is called the ____________ variable (hint: this is what you are interested in)
dependent variable
400
Describe what a control group is used for
to compare with the experimental group
400
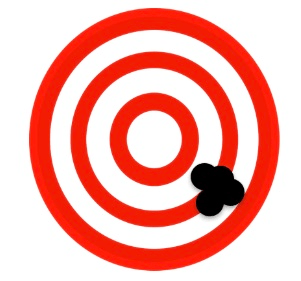
Use the words ACCURATE and PRECISE to say what is happening with this target
Precise but not accurate
500
the degree to which measurements agree with one other.
Precision
500
Covert 8.21 deciliters to decaliters
0.0821 daL
500
This type of graph compares QUANTITATIVE data vs. QUANTITATIVE data
line graph
500
what is being purposefully changed; what is being tested; the “cause”, the ‘x-axis’ on a graph. This is called the __________ variable
independent variable
500
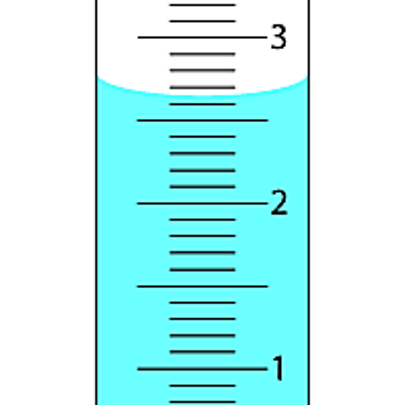
What is this measurement (in mL)?
2.65 mL