Vocabulary Level 1
Graph & Data Analysis
Vocabulary Level 2
Unit 1 Other
100
What does BIOTIC mean?
A biotic factor is something that is or was alive, or came from a living thing.
A wildebeest, dead or alive, is a biotic factor.
100
Describe the trend in this graph.
The trend is positive but weak - notice the data points are scattered but moving up from left to right.
100
Name two ways a population can decrease
Death and emigration
100
What position on a food pyramid does a golden eagle occupy?
Apex predator/carnivore.
200
What type of growth curve is this?
Exponential growth curve - limiting factors have NOT impacted the population. There is unlimited access to food, mates, shelter, etc. so the population is growing very fast.
200
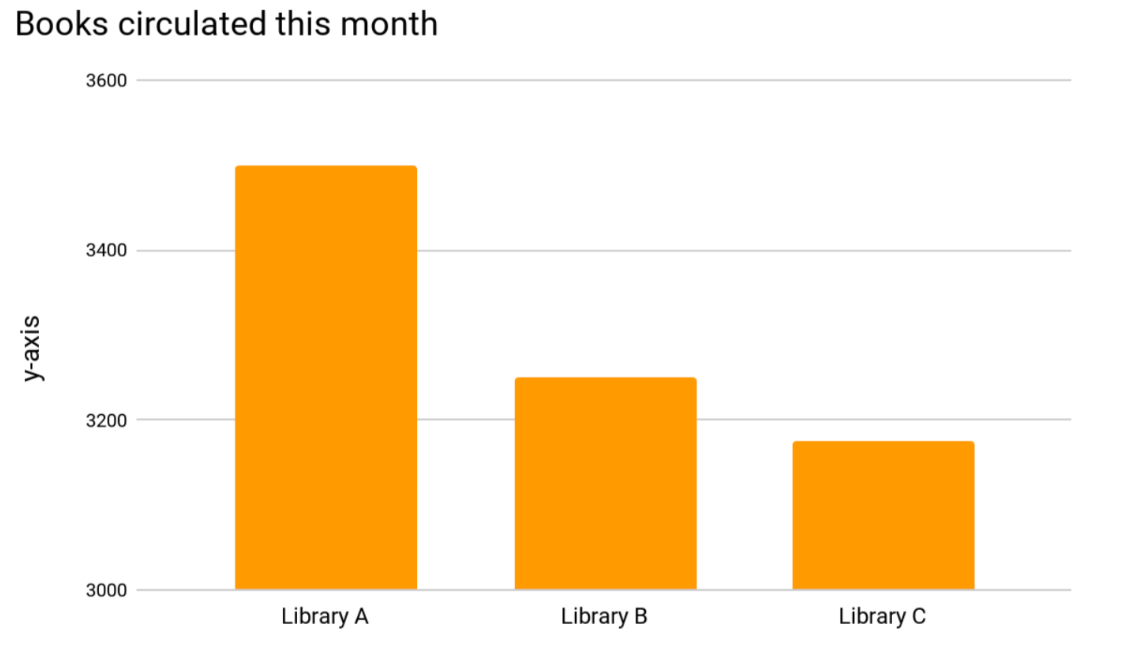
Compare Libraries A, B, and C - what do you notice about this graph?
The bars make it appear as though Library A has distributed twice as many books as Library C.
Look at the scale on the y-axis - what is the actual difference? Why would someone do this?
200
This type of limiting factor impacts all members of a population within a certain area, does not matter how close together they live.
Density-independent limiting factors include natural disasters and extreme weather events.
200
Which national park has a problem with invasive quagga mussels?
Lake Michigan - the mussels attach to boats in other bodies of water. When boaters do not clean their boat between uses, the mussels can be released into the lake. With no real predators and a huge food supply, their population grows exponentially.
300
What does ABIOTIC mean?
Something in the environment that is not and never was alive.
Rocks, water, and temperature are abiotic factors.
300
Describe the trend in this graph.
The trend is negative and strong - the data points decrease from left to right and the points are close together.
300
This is the largest population of a species that can live in an ecosystem without causing damage - depleting the food supply, for example.
Carrying capacity
300
What type of organism is a fish - type 1, type 2, or type 3?
Explain.
Type 3 - they have MANY offspring, most of whom will not survive to reproductive age. Their strategy to overcome high mortality is to produce many offspring.
400
Name the two ways a population can INCREASE
Birth and Immigration
400
What could cause the carrying capacity to increase or decrease?
Increase - new or increased food supply, reduced predation, vaccinations, more territory, etc.
Decrease - new predator, long term drought, increased competition, etc.
400
This type of limiting factor gets stronger or more intense when the population gets dense, or more crowded.
Density-dependent limiting factors include disease and competition for resources.
400
The major abiotic component driving the Hoh River ecosystem was marine-derived nitrogen. Explain how this sequence works.
Salmon spend their lives at sea absorbing marine-derived nitrogen. Salmon return to "land" by swimming upriver to their spawning grounds. Many are eaten by bears, who absorb the marine-derived N and spread it through the forest in their poo. Plants grow 3x taller and 3x faster with this nitrogen.
500
What type of growth curve is this?
Logistic growth curve - shows the impact of limiting factors on a population.
500
Describe the trends in this graph.
The populations of lynx and hare are closely tied together - as hare increase, so do lynx. But then there are so many lynx that the hare population crashes...then the lynx population crashes.
Then the cycle repeats.........
500
Name 3 limiting factors that impact the wildebeest along the migration.
Predators, disease (anthrax), lack of food, drought, birth, death........
500
What position on a food pyramid to humans occupy?
Secondary consumers - omnivores
Humans are not apex predators.