Spread
Center
Dot Plots/Histograms
Box Plots
Mixed
100
This is the overall variability of the data set. It can be found by subtracting the minimum value from the maximum value (Max-Min).
Range
100
This measure of center can also be called the average or fair share.
Mean
100
What was the range of goals scored?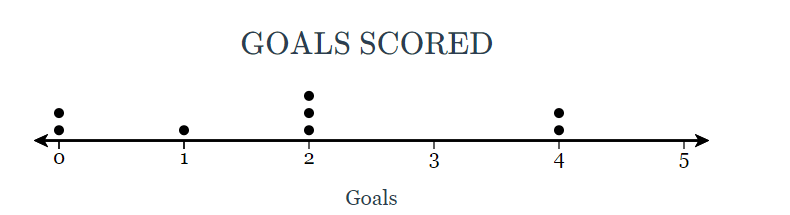
4 goals
100
What is the median of the following box plot?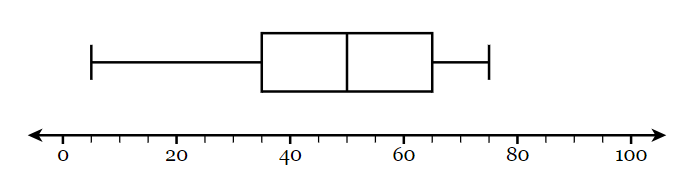
50
100
True or False. "What is the temperature outside today?" is a statistical question.
False
200
This measure of spread is the variability of the middle 50% of the data. It can be found by subtracting the lower quartile from the upper quartile (Q3-Q1).
Interquartile Range (IQR)
200
This measure of center is the middle value of the data set.
Median
200
How many people were surveyed?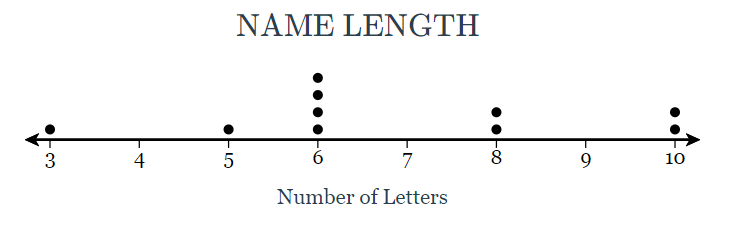
10
200
What is the Q3 or upper quartile of this box plot?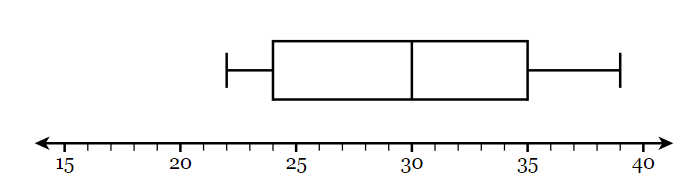
35
200
What is the median of the following data set?
30, 2, 7, 10, 19
10
300
List the elements of the 5 number summary.
Minimum, Q1, Q2/Median, Q3, Maximum
300
How do you find the median if there are two middle values in your data set?
Find the mean of those two middle values
300
For how many days was the temperature recorded?
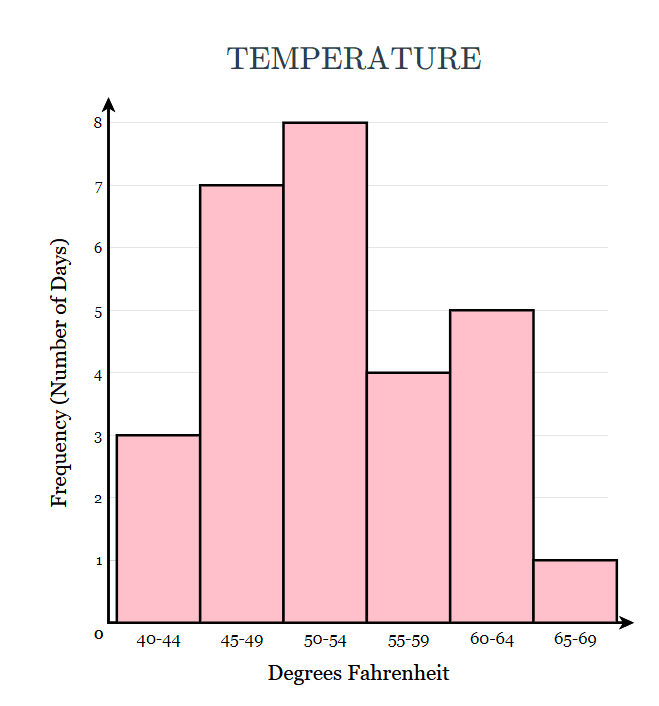
28 days
300
What is the range of the box plot?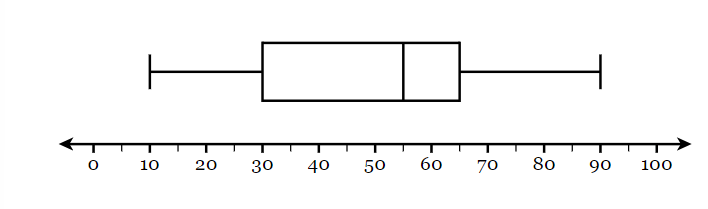
80
300
What is the mean of the data set?
18, 21, 26, 35
25
400
This measure of spread is the data's average distance from the mean. It describes the consistency of the data.
Mean Absolute Deviation (MAD)
Double points!
400
Jacob has 4 tennis balls, Brian and Emily both have 10. How many more tennis balls would Jacob receive if they were all given a fair share?
Jacob would receive 4, everyone would have 8.
400
Over which interval were there exactly two students?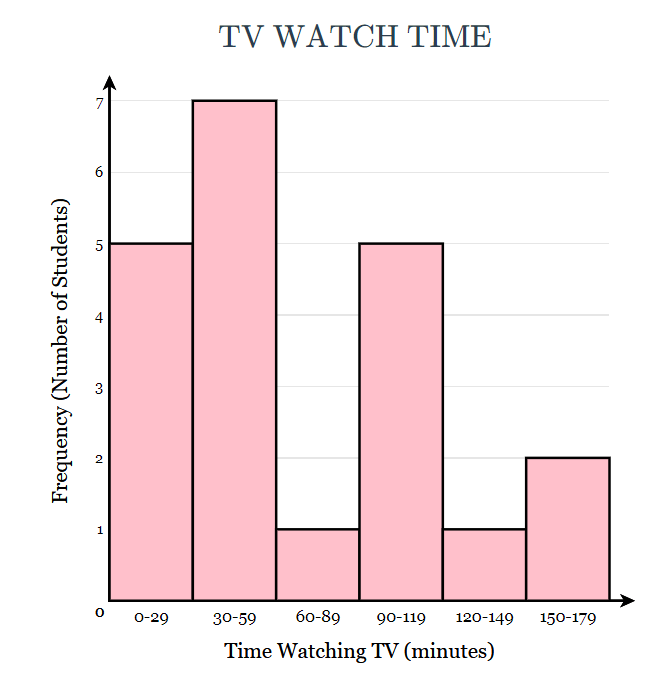
150-179 minutes
400
What is the IQR of the box plot?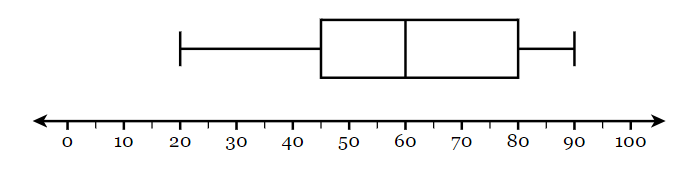
35
400
What is the median of the following data set?
21,40,48,26,32,31
31.5
500
The following sets of data are the touchdowns thrown by Patrick Mahomes and Tua Tagovailoa.
Mahomes: 50, 20, 60, 21, 55
Tua: 32, 34, 28, 36, 30
Which player has the lower MAD?
Tua, his TD #s are more consistent
500
Which measure of center (Mean, Median, Mode) best describes the data when there is an outlier?
Median
Double pointer!!!
500
How many students scored 70 or more on the quiz?
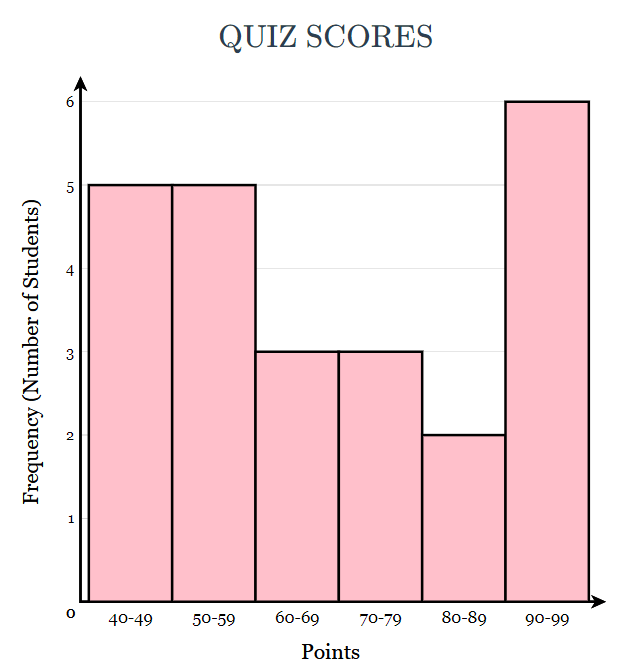
11
500
Which box plot has the larger IQR?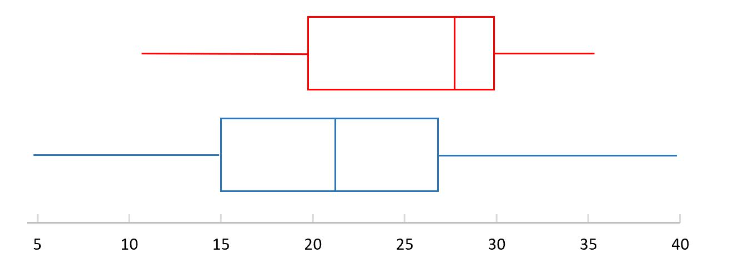
Blue. The IQR is around 12, while the red IQR is 10.
500
The following data represents the amount of points the Miami Dolphins scored in their last 6 games:
40, 24, 2, 20, 48, 24
Which measure of center would be affected by the removal of the outlier? Would it increase or decrease?
Mean; Increase
Double the questions, double the points!!!