Dimensional Analysis
Reading Measurements
Scientific Notation/Sig Figs
Lab Equipment
Data
100
Convert 250cm to meters
2.5 meters
100
What is the smallest marking on this ruler?

1mm or 0.1cm
100
Write 56,000 in scientific notation with 2 significant figures.
5.6 x 10⁴
100
What piece of equipment is used to measure liquid volume most accurately: beaker or graduated cylinder?
Graduated Cylinder
100
Define accuracy in scientific measurements.
When a measurement is close to the true/accepted/theoretical value.
200
How many grams are there in 3.5 kilograms?
3,500 g
200
Report the length of the red rectangle
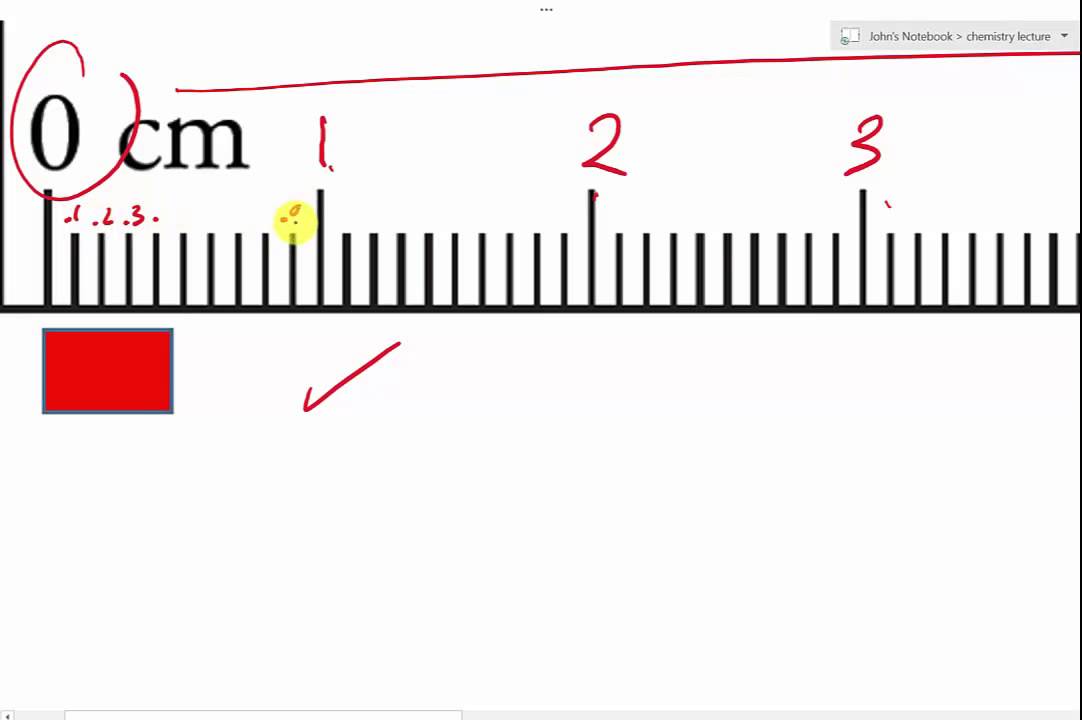
0.45cm
200
How many significant figures are in 0.004530?
4
200
Name this equipment
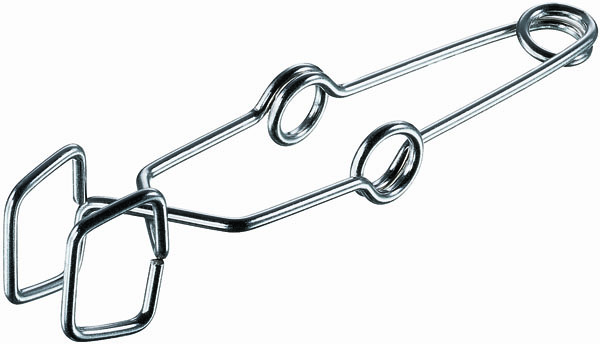
Test Tube Holder
200
Define precision in scientific measurements.
When measurements are close to one another
300
Convert 12.5 hours to seconds
45,000 seconds
300
Report the volume of the liquid in the graduated cylinder

12.8 mL
300
Write 2.8 × 10-⁴ as standard number
0.00028
300
Name the piece of equipment used to grind solids into powders.
Mortar and Pestle
300
A student measures the boiling point of water as 99.9°C, 100.0°C, and 99.8°C. The true value is 100.0°C. Are the measurements accurate, precise, or both?
Both
400
If a car travels 60 miles per hour, how many meters does it travel in 2 minutes? (1 mile = 1609 m)
3,218 meters
400
If the scale reads 45.20 g, how many decimal places should you report?
2 (all of them)
400
Multiply: (2.45 × 10³) × (3.2 × 10²). Give your answer with correct sig figs.
780,000 or 7.8 x 10⁵
400
Which piece of lab glassware has a narrow neck, a flat bottom, and is often used for swirling mixtures without spilling?
Erlenmeyer Flask
400
Which variable goes on the x-axis of a graph: independent or dependent?
independent
500
A density is given as 2.70 g/cm³. Convert this to kg/m³.
2,700 kg/m³
500
Why should you always record one more digit than the smallest marked division on a measuring tool?
The smallest marking tells us the precision of the tool. We can still estimate between the smallest markings. The extra digit shows our uncertainty in the measurement
500
Divide: (6.72 × 10⁻⁴) ÷ (8.0 × 10²). Give your answer with correct sig figs.
0.00000084 or 8.4 x 10⁻⁷
500
What is the name and purpose of this lab equipment
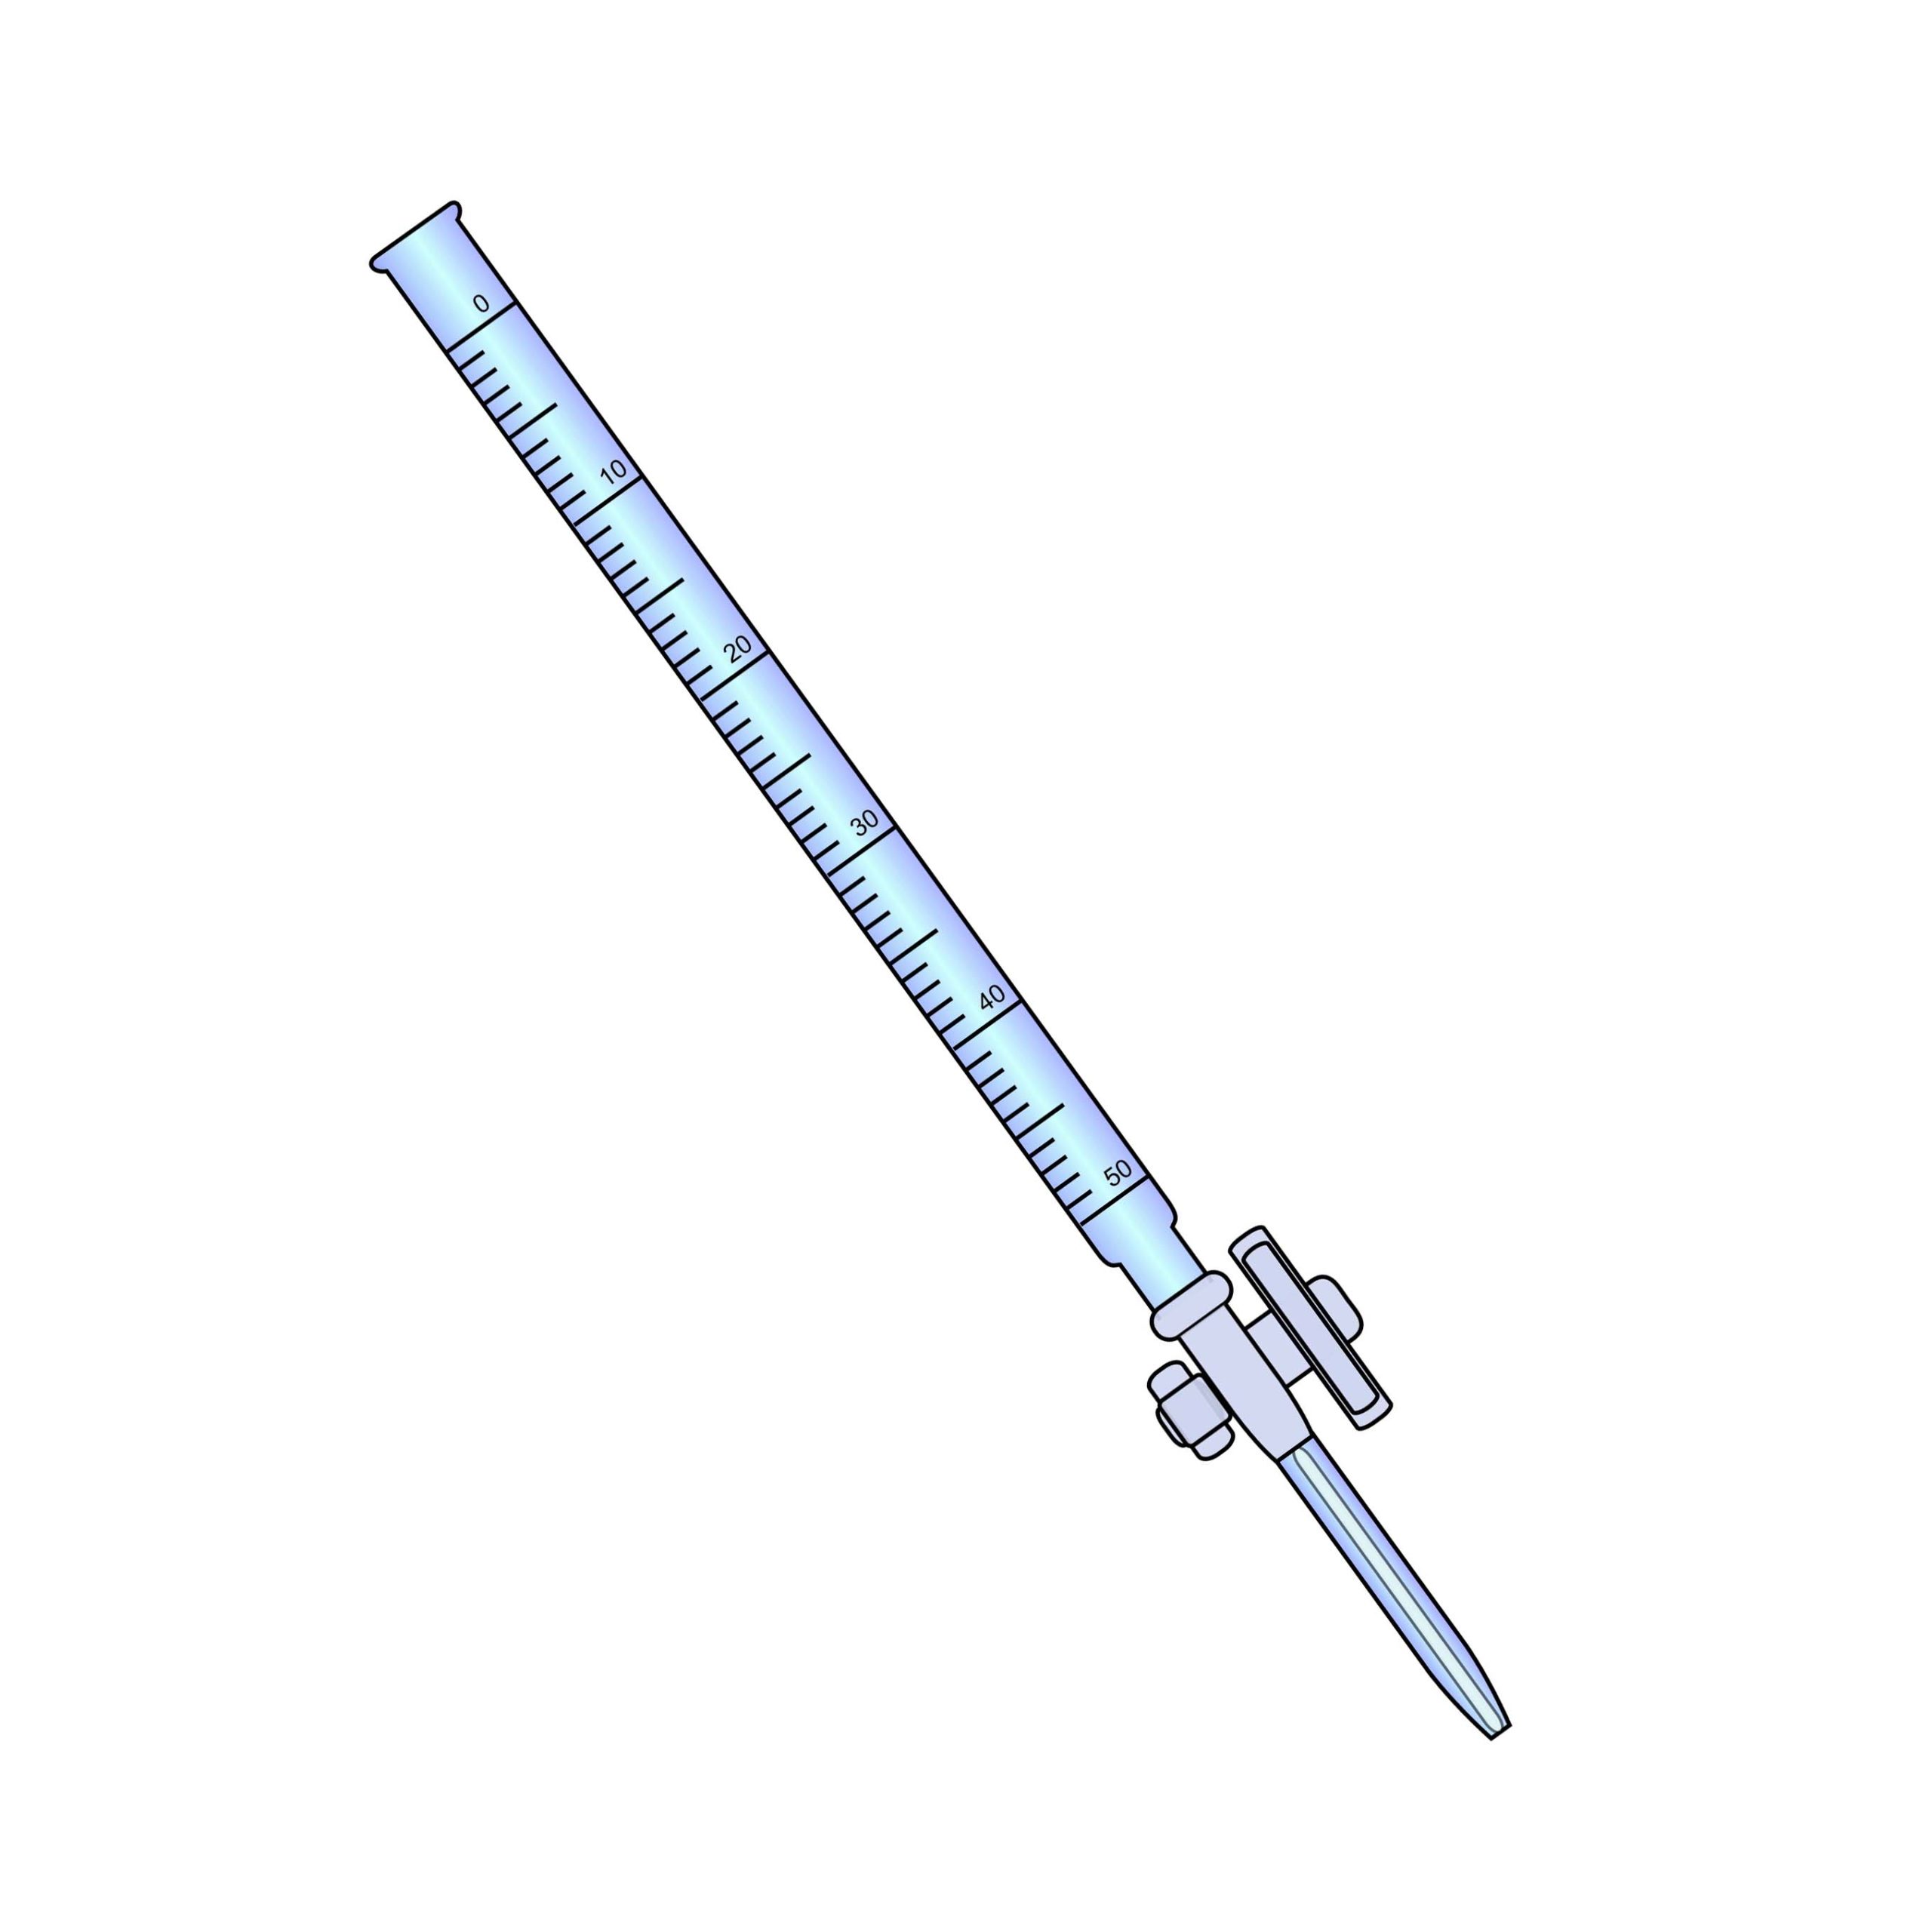
Buret - dispense precise volume of liquid
500
What kind of graph would be best to visualize this data?
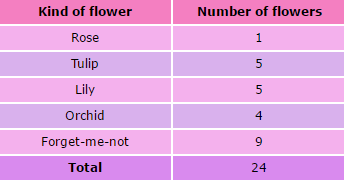
Bar graph