Identify Population and Variables
Frequency/ Relative Frequency
Data Displays
Describe a Distribution
Z-score
100
A coach records the number of points scored in a game. Identify and classify the variable
number of points scored is the discrete quantitative variable
100
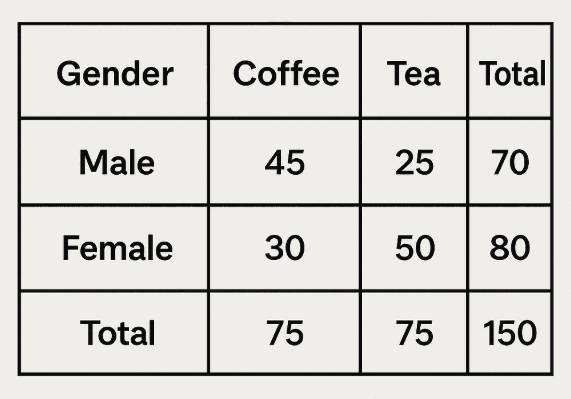
What is the joint frequency of females who prefer tea?
50
100
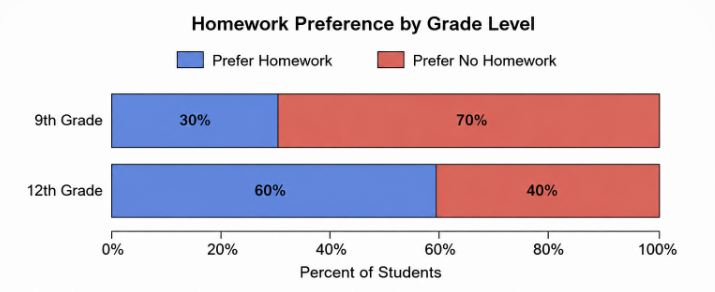
True or false: There are more 12th graders that prefer homework compared to 9th graders.
false! don't know anything about counts
100
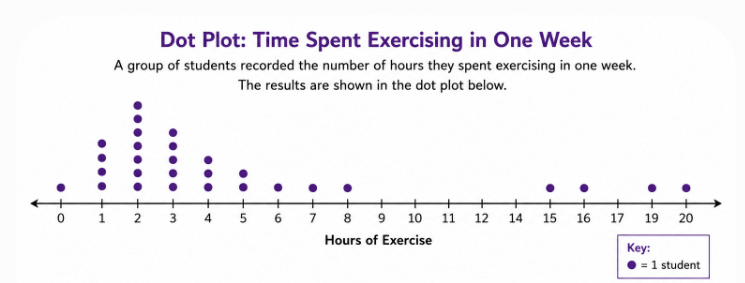
Describe possible unusual features for the distribution.
gap between 8-15 hours
or
possible outliers at 15, 16, 19, 20 hours
must include context
100
The scores on a statistics test are approximately normally distributed with a mean of 75 and a standard deviation of 8. Jessica scored an 89.
What is Jessica's z-score? What does her z-score mean in context?
z = 1.75
Jessica's test score (89) is 1.75 standard deviations above the mean (75).
200
A researcher wants to determine how much sleep high school students get on school nights. She randomly selects 500 students from the 10,000 students in the school district. Students report their age, grade level, hours of sleep, number of extracurricular activities, and whether they have a part-time job.
What is the population?
10,000 students in the school district
200
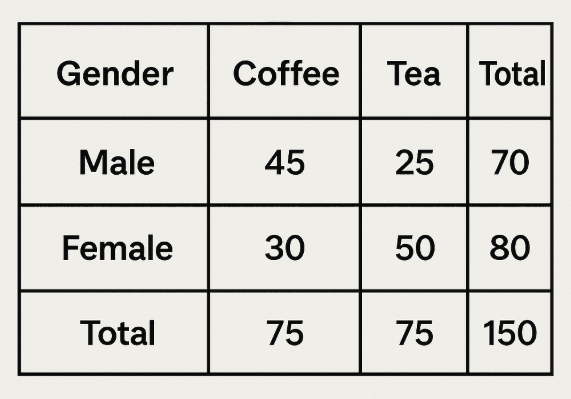
What is the relative joint frequency of females who prefer coffee.
30/150 = .2 or 20%
200
A teacher surveys 50 students and records each student's favorite type of pet (dog, cat, fish, bird, or other). She wants to show how the students are distributed among the different categories.
Which display would you use?
bar graph
200
Number of text messages sent in 1 day from 28 different individuals.
key 2|5 = 25 text messages
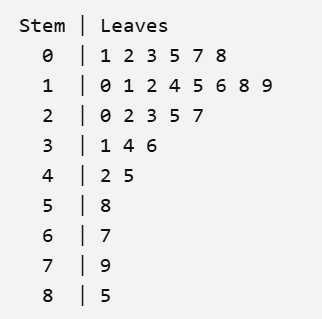
What is the shape of this distributions?
skewed to the right
200
The heights of adult women in a certain population have a mean of 64 inches and a standard deviation of 2.5 inches.
A woman has a z-score of −1.2.
What is her height?
61 inches
must have context in answer
300
Researchers want to investigate whether there is an association between smoking history and lung disease. They identify 500 adults who were diagnosed with lung disease and 500 adults without lung disease. Using existing medical records, the researchers look back at each person's smoking history over the previous 20 years.
Identify the type of study done
observational - retrospective
300
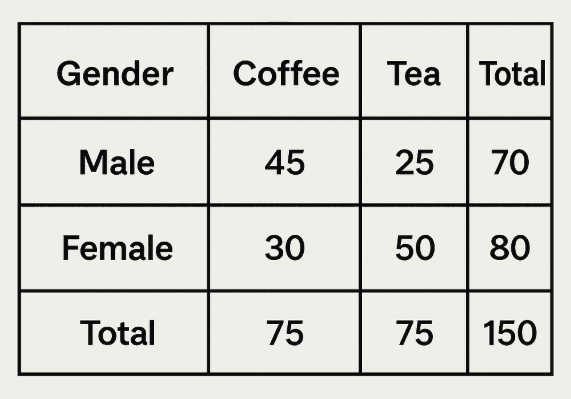
Given that the participant is a male, what is the relative frequency that they prefer coffee?
45/70 = .642857 or 64.2857%
300
A coach records the heights of 100 basketball players. She wants to group the heights into intervals such as 60–64 inches, 65–69 inches, 70–74 inches, etc. and examine the shape of the distribution.
Which display would you use?
histogram
300
The boxplots below show the delivery time distributions (in minutes) for Big Slice and City Pizza.
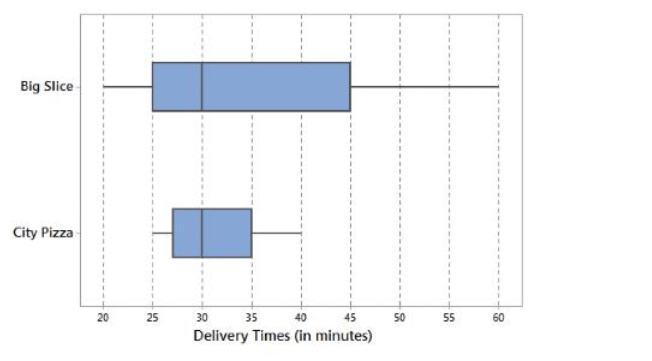
Compare the spread.
The IQR for Big Splice (20 minutes) is greater than the IQR for City Pizza ( 8ish minutes).
300
The scores on a statistics test have a mean of 72 and a standard deviation of 8.
The teacher decides to add 5 points to every student's score because the test was more difficult than expected.
What is the new mean and standard deviation?
What is the new mean and sd?
mean = 80 points
sd = 8 points
400
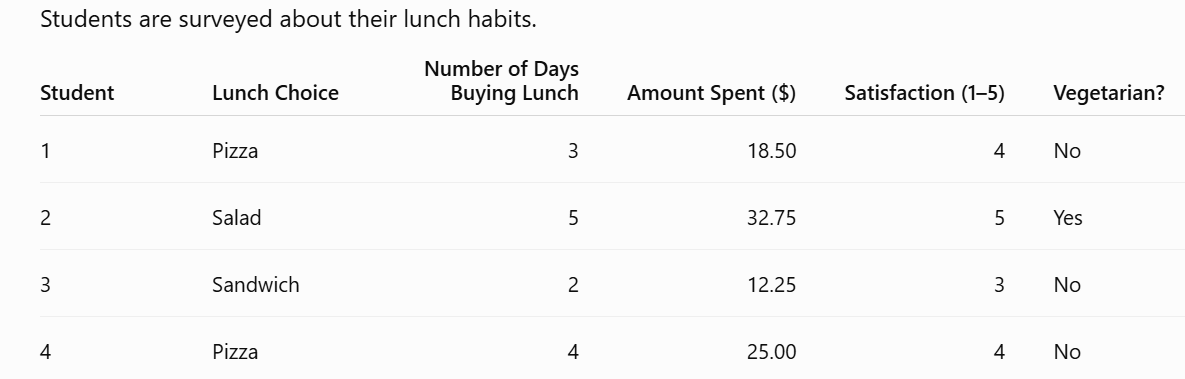
Identify and classify variables.
lunch choice - categorical
number of days buying lunch - discrete quantitative
amount spent - continuous quantitative
satisfaction - categorical
vegetarian? - categorical
400
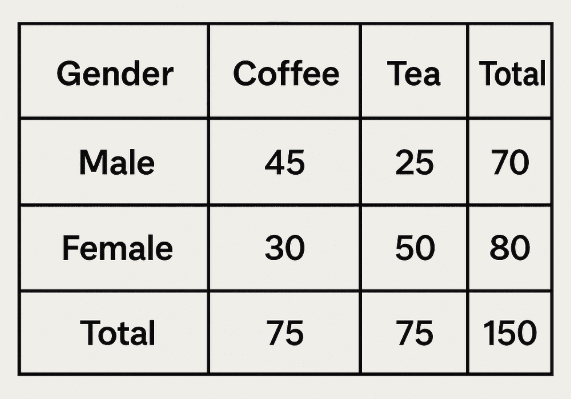
What is the marginal frequency of tea being preferred?
75
400
A teacher records the number of siblings for 30 students. The values range from 0 to 6, and she wants a display that allows students to see each individual observation and the overall shape.
Which display would you use?
dot plot
400
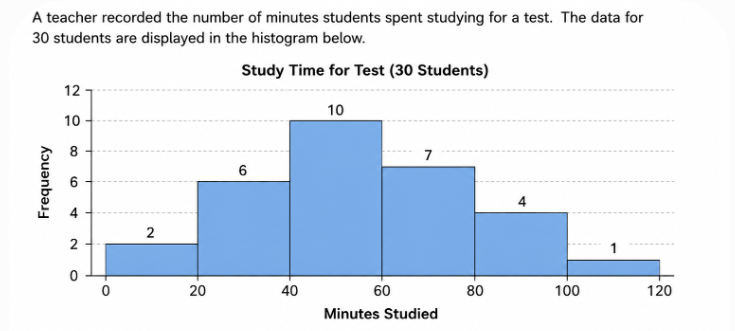
Describe the center of the distribution.
The median is between 40-60 minutes.
Must include context for credit.
400
The scores on a statistics test have a mean of 72 and a standard deviation of 8.
The teacher decides to every student's score by 1.1 because the test was more difficult than expected.
What is the new mean and standard deviation?
mean = 79.2 points
sd = 8.8 points
500
A teacher wants to determine whether students who spend more time studying tend to perform better on an AP Statistics test.
Identify and classify the variables.
time students spend studying - quantitative, explanatory
AP stats score - quantitative, response
500
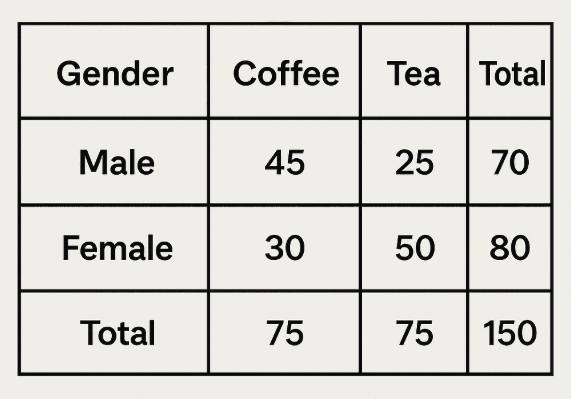
What is the marginal relative frequency that the gender is female?
80/150 = .5333 or 53.33%
500

Are the variables associated? Justify your answer.
yes because percentages are different
500
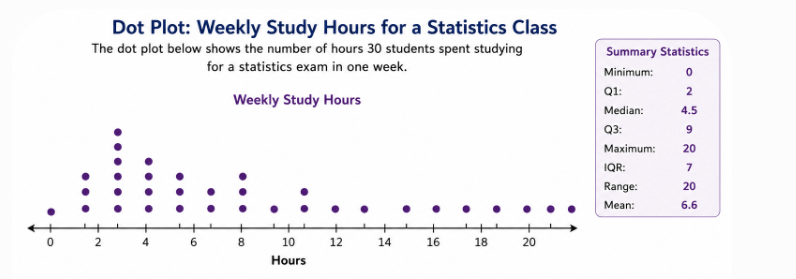
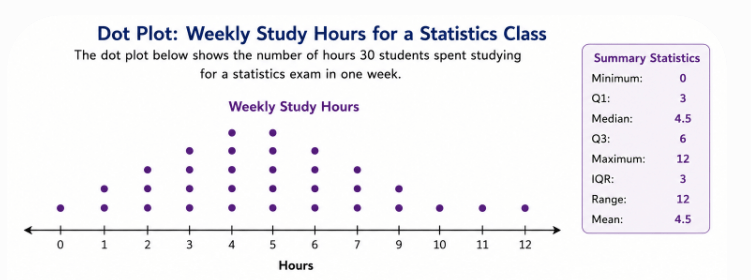
Compare the center and spread for the two dot plots.
Both weeks have a median of 4.5 hours. Week 1 has a greater IQR (7 hours) compared to week 2 (3 hours).
500
Two students take different tests.
- Math: Mean = 80, SD = 10, Student's score = 95
- English: Mean = 75, SD = 5, Student's score = 82
On which test did the student perform better relative to the other students?
math student z score = 1.5
english student z score = 1.4
The math student scored 1.5 standard deviation above the mean, which is greater then the 1.4 standard deviation above the mean of the english student.