6.NR.2.5
Relate the choice of measures of center and variability to the shape of the data distribution and the context in which the data were gathered.
6.NR.2.1Describe and interpret the center of the distribution by the equal share value (mean).
6.NR.2.4
Design simple experiments and collect data. Use data gathered from realistic scenarios and simulations to determine quantitative measures of center (median and/or mean) and variability (interquartile range and range). Use these quantities to dra
6.NR.2.2
Summarize categorical and quantitative (numerical) data sets in relation to the context: display the distributions of quantitative (numerical) data in plots on a number line, including dot plots, histograms, and box plots and display the distrib
Any 6.NR.2
Apply operations with whole numbers, fractions and decimals within relevant applications.
100

Marlene has the following scores on her vocabulary tests.

89, 85, 73, 88, 95

If Marlene gets a score of 86 on her next test, what will happen to the MEAN of her scores?


It will stay the same.

100

Ruby has four bags of marbles. She counted the number of marbles in each bag. Ruby says that the mean number of marbles is 24. Which sentence is the best interpretation of Ruby’s statement?

A. If the total number of marbles were distributed equally among the four bags, each bag would have 24 marbles.

B. The total number of marbles is 24. 

C. The number of marbles in each bag is 24.


If the total number of marbles were distributed equally among the four bags, each bag would have 24 marbles.

100

Students rolled a number cube several times and recorded the results:

1, 2, 2, 3, 4, 4, 5, 6

What is the interquartile range (IQR) of the data?

Q1 = 2, Q3 = 5 → IQR = 5 − 2 = 3

100

DOK 2

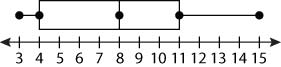
This box plot represents the number of points Jonelle scored in each of 9 basketball games.

What is the Median for this box plot?

8

100

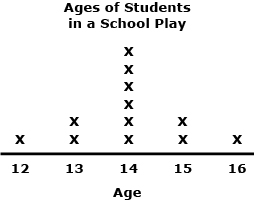
The dot plot below shows the ages of students in a school play.  Each X represents one student.


How many students participated in this study?

12 students 

200

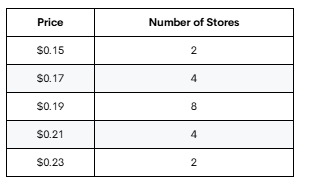
During the month of August, 20 different retail stores have spiral notebooks on sale. The prices of these notebooks are shown in the table.


Which is the most representative measure of center for this data?

Mean

200

What is the MEAN of a set of numbers?


the average of all the numbers

200

A teacher recorded the number of minutes 5 students spent reading:

10, 15, 20, 20, 25

What is the mean number of minutes spent reading?

18

200

DOK 2

This box plot represents the number of points Jonelle scored in each of 9 basketball games.

What is the 5 # summary for this data?

min:3

Q1:4

Q2:8

Q3:11

max:15

200

The dot plot below shows the ages of students in a school play.  Each X represents one student.


Describe the shape of the distribution?

Symmetrical 

300

Luis recorded the number of chocolate milks sold in his school cafeteria each day last week.  His results are shown below.


0, 98, 94, 106, 105


Which of the following would be the most representative measure of center for the data Luis collected?


Median 

300

In a basketball game, the number of baskets a team shot is: Team 1: 2, 7, 3, 4, 2 Find the mean

Mean= 3.6

300

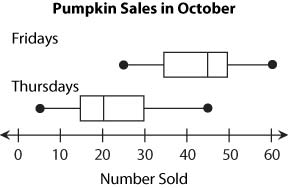
Annette sold pumpkins as a community fundraiser. She used the plot below to compare the number of pumpkins sold on each Thursday in October and the number sold on each Friday in October.

Which statement about the data variability is true?

A. The interquartile range is the same for sales on Thursdays as it is for sales on Fridays.

B. The interquartile range is greater for sales on Fridays than it is for sales on Thursdays.

C. The range is the same for sales on Thursdays as it is for sales on Fridays.

D. The range for sales on Thursdays is less than the range for sales on Fridays.


The interquartile range is the same for sales on Thursdays as it is for sales on Fridays.

300

DOK 2

This box plot represents the number of points Jonelle scored in each of 9 basketball games.

Explain what the IQR is for this box plot?  How did you find it? 

Answer: The IQR is 7.

  • Q1 = 4
  • Q3 = 11
  • IQR = Q3 − Q1
  • IQR = 11 − 4 = 7

Explanation: The middle 50% of Jonelle’s basketball scores are spread across 7 points.

300

What is the range of the data set shown below?

{ 1,  1,  1,  4,  5,  6,  7, 15}

14

400

For which data set is the median a much better measure of center than the mean?

A. 7, 9, 9, 10, 12, 12, 14, 15, 16, 16

B. 11, 15, 16, 17, 17, 17, 19, 22, 24, 92

C. 81, 84, 85, 86, 86, 88, 90, 92, 93, 95

B. 11, 15, 16, 17, 17, 17, 19, 22, 24, 92

400

 The numbers of books read by 5 students are 2, 4, 5, 6, and 8. If the books were shared equally among the 5 students, how many books would each student have? Explain how this equal-share value relates to the mean of the data set.

2 + 4 + 5 + 6 + 8 = 25
25 ÷ 5 = 5

The mean is 5 because if all 25 books were shared equally among the 5 students, each student would have 5 books.

400

Two groups completed the same puzzle. Their completion times, in minutes, are shown.

Group A: 4, 5, 5, 6, 10
Group B: 5, 6, 6, 7, 8

Which statement best compares the data?

A. Group A has a greater median and a smaller range.
B. Group B has a greater median and a smaller range.
C. Both groups have the same median and range.
D. Group B has a smaller median and a greater range.

B. Group B has a greater median and a smaller range.

400

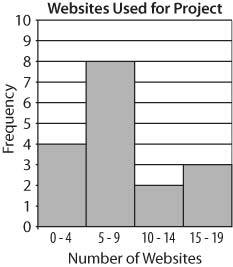
Mr. Brower assigned each student in his science class a research project. He recorded the number of websites each student used for his or her project. He used the data to create the histogram shown below.


Which set of data did he use to create the histogram?

A. {3, 7, 4, 6, 14, 8, 9, 1, 4, 12, 8, 9, 7, 16, 2, 15, 17}

B. {3, 7, 4, 6, 14, 8, 9, 6, 4, 12, 8, 9, 7, 16, 2, 15, 17}

C. {3, 7, 4, 6, 14, 8, 9, 11, 6, 4, 12, 8, 9, 7, 16, 2, 5}


{3, 7, 4, 6, 14, 8, 9, 6, 4, 12, 8, 9, 7, 16, 2, 15, 17}


400

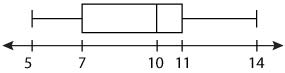
A data set is represented in the plot below.

Which measure of variability can most easily be found by using the information in the plot?

A. Range 

B. IQR

C. MAD


interquartile range

500

The numbers of texts sent by six friends in one day were 16, 15, 22, 24, 5, and 20. How is the mean of the data affected if the outlier, 5, is removed?

A. The mean increases by 5 to to 22.

B. The mean remains the same.

C. The mean increases from 17 to 19.4.


C. The mean increases from 17 to 19.4.

500

Five students collected cans for a recycling project. The numbers of cans collected were:

6, 8, 10, 12, 14

If the cans were shared equally among the 5 students, how many cans would each student have? Explain what this value represents in the data set.

6 + 8 + 10 + 12 + 14 = 50
50 ÷ 5 = 10

Each student would have 10 cans. The mean is 10, which represents the equal-share value of the data set.

500

Students tested how many times they could bounce a ball in 30 seconds. The results were:

12, 15, 17, 18, 18, 20, 22

What are the median and range?

Median = 18; Range = 10

500

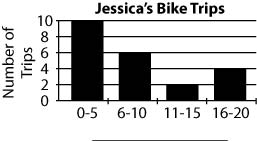
Jessica took some bike trips during her summer vacation. The histogram shows how far she rode on the trips.

Which of the following units of measurement is the best choice for the label on the horizontal scale in the histogram?

A. miles

B. yards

C. feet


miles

500

Which of the following numerical data sets has a mean of 40?

A. 18, 142

B. 22, 40, 43

C. 31, 33, 42, 44, 50


C. 31, 33, 42, 44, 50

M
e
n
u