Variables
Displaying Distributions
Describing Distributions
5-number summary
100
The object described by a set of data.
What is an individual?
100
The name of this type of graph. 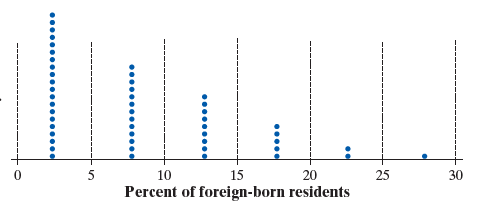
What is a dotplot?
100
CUSS stands for this.
What is center, unusual, shape, and spread?
100
minimum, first quartile, median, third quartile, maximum
What is the 5-number summary?
200
Two types of quantitative variables
What is discrete and continuous?
200
The name of this type of graph.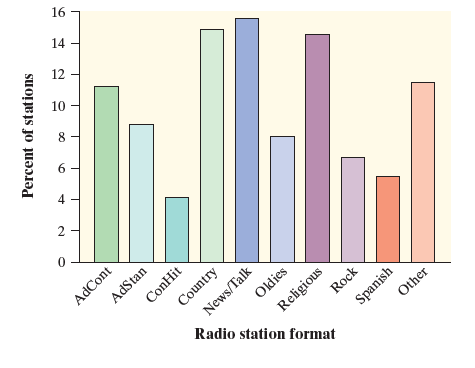
What is a bar chart?
200
This graph has 2 peaks.
What is bimodal?
200
The median of this dataset:
7, 5, 3, 7
What is 6?
300
Identify the individuals.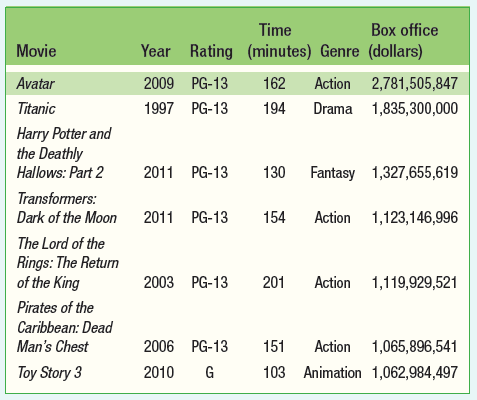
What are movies?
300
You should not forget to include this when creating a stemplot.
What is a key?
300
The shape of this distribution.
What is right-skewed (skewed to the right)?
300
Any value that is farther than 1.5xIQR past either of the quartiles.
What is an outlier?
400
Classify the variables (categorical vs. quantitative).
Categorical - rating and genre
Quantitative - year, time, box office sales
400
Three graphical displays that can be used for quantitative data.
What is a histogram, stemplot, and dotplot? (boxplot also accepted)
400
A list of measures of spread (up to 3).
What are standard deviation, range, and IQR?
400
Use this measure of center if there are no outliers and no strong skewness.
What is the mean?
500
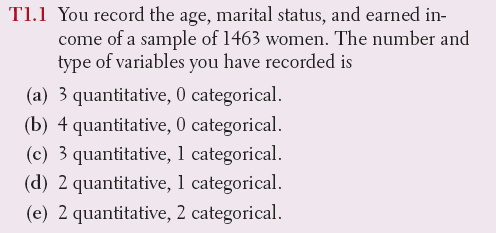
What is D (2 quantitative, 1 categorical)?
500
The kind of table this is.
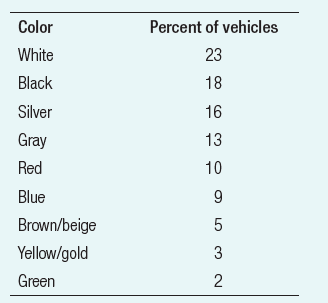
What is a relative frequency table?
500
The shape of this distribution.
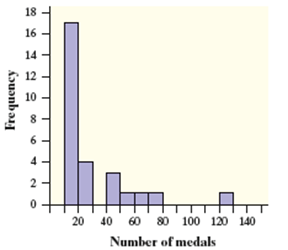
What is right-skewed (skewed to the right)?
500
The IQR of this (summarized) data:
min: 100
Q1: 114
median: 120
Q3: 134
max: 180
What is 20?