Measures of Center
Measures of Spread
Data Display
Data Display
Challenge
100
Mean, Median, and Mode are ____________
Measures of Center or Measures of Central Tendency
100
MAD, Range and Interquartile Range (IQR) are ________________.
Measures of Variation or Measures of Spread
100
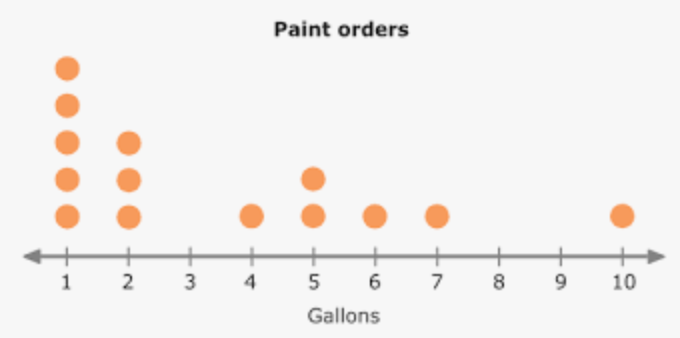
Describe the distribution of the data.

The data is skewed to the right.
100
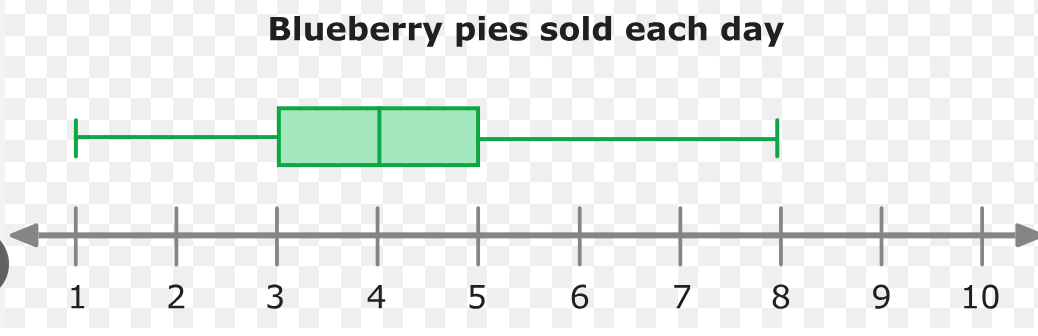
The median number of pies sold is _________.
The median is 4.
100
Kim practiced basketball once a day for five days: 30 minutes, 50 minutes, 25 minutes, 25 minutes, and 40 minutes. She said that her mean score is 42.5 minutes.
Her Work: 170/4 = 42.5
Is she correct? If not, what is the correct mean?
30 + 50 + 25 + 25 + 40 = 170
170/5 = 34
She is incorrect. Her sum is correct, but she did not divide correctly. The correct mean is 34.
200
Janet ran one mile a day for five days. Her times are 10 minutes, 12 minutes, 15 minutes, 10 minutes, and 9 minutes. What is her mean time?
10 + 12 + 15 + 10 + 9 = 56
56/ 5 = 11.2
The mean is 11.2 minutes.
200
Group _________ had the highest median shopping time.

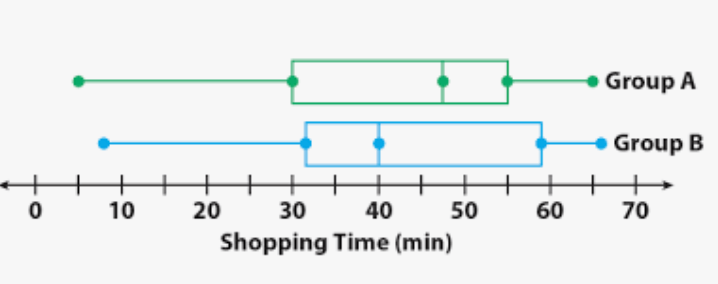
Group A
200
What is the median?
1,1,1,1,1,2,2,2,4,5,5,6,7,10
Median = 2

200
What is the interquartile range (IQR)?


IQR = Q3 - Q1
IQR = 5 - 3
IQR = 2
200
Janet practiced once a day for five days: 45 minutes, 40 minutes, 45 minutes, 50 minutes, 0 minutes. She said her mean number of minutes is 45 minutes. Is she correct? If not, what is the correct mean.
Her Work: 180/4 = 45
45 + 40 + 45 + 50 =180
180/5 = 36
She is incorrect. Her sum is correct, but she did not divide by the correct number. She should divided by 5. The correct mean is 36 minutes.
300
Kim ran one mile a day for five days. Her times are 15 minutes, 13 minutes, 15 minutes, 13 minutes, and 14 minutes. What is her mean time?
15 + 13 + 15 + 13 + 14 = 70
70/5 = 14
The mean time is 14 minutes.
300
Janet: 10, 12, 15, 10, 9
Kim: 15, 13, 15, 13, 14
Janet's Mean = 11.2
Janet's MAD = 1.84
Kim's Mean = 14
Kim's MAD = 0.8
Which person is more consistent?
Janet's Mean = 11.2
Janet's MAD = 1.84
Kim's Mean = 14
Kim's MAD = 0.8
Kim because her MAD is the smallest.
300
How many parks have more than 20 roller coasters?


2 + 6 = 8 parks
(21 to 25) + (26 to 30)
300
______ percent of data gathered is between
3 and 5.

50 percent of data is between 3 and 5.
300
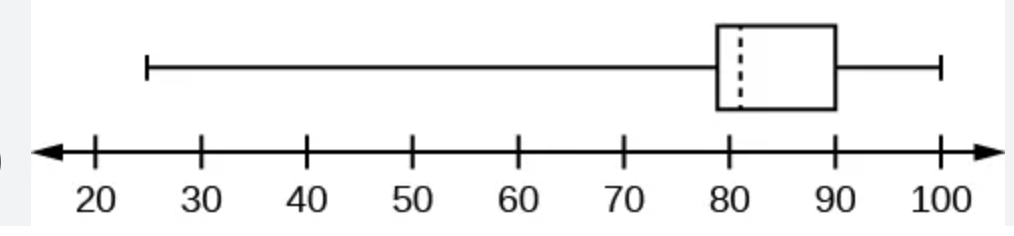
What is the range?
What is the IQR?
What is the most appropriate measure of center to describe the central tendency of the data?
The range is 100 - 25 = 75.
The IQR is 90 - 80 = 10.
The median is the most measure of center because the numbers vary greatly.
*outlier is 25, very spread out data
400
What is the most appropriate measure of center to describe the data set? Why?

The median age is the most appropriate measure of center because the ages vary greatly.
400
Kim: 45, 40, 45, 50, 45
Janet: 30, 50, 25, 25, 40
Kim's Mean = 45
Kim's MAD = 3
Janet's Mean = 34
Janet's MAD = 8.8
Which person is more consistent?
Kim's MAD = 3
Janet's MAD = 8.8
Kim because her MAD is the smallest.
400
The number of roller coasters for ___ parks is under 16.
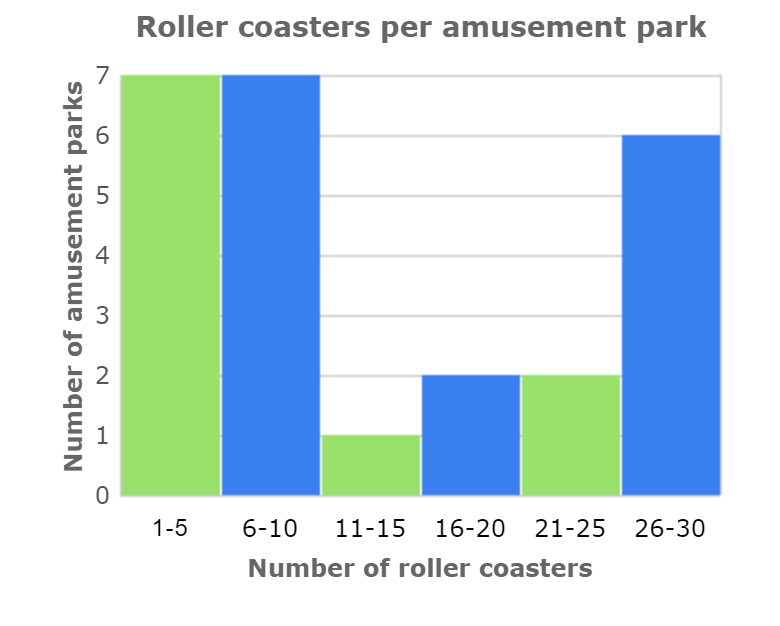
(1 - 5 ) +(6 - 10) +(11 to 15)
7 + 7 + 1 = 15 parks
400
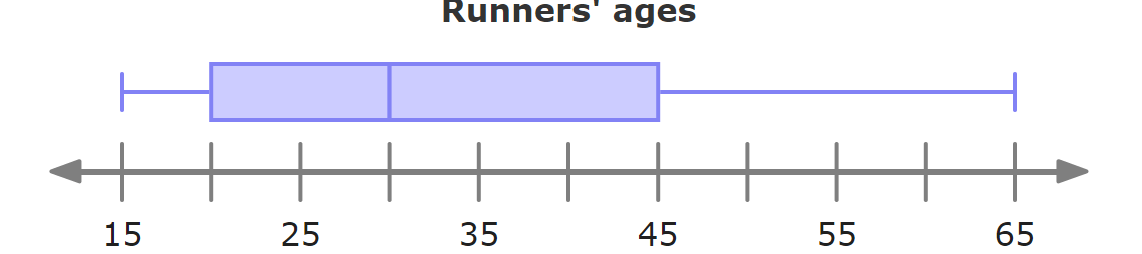
The median is ______ and the range is _______.
The IQR is ______.

Median = 30
Range = Max - Min
Range = 65 - 15 = 50
IQR = Q3 - Q1
IQR = 45 - 20 = 25

400
Janet: 15, 12, 12, 9, 12
Kim: 15, 10, 10, 8, 7
Janet's Mean = 12
Janet's MAD = 1.2
Kim's Mean = 10
Kim's MAD = 2
Who is more consistent? Why?
Janet's MAD = 1.2
Kim's MAD = 2
Janet is more consistent because her MAD is the smallest.
500
1, 4, 5, 6, 6, 7, 9, 1, 7, 17
Which measure of center is most appropriate for measuring the central tendency for this data set? Why?
1, 4, 5, 6, 6, 7, 9, 1, 7, 17
The median is most appropriate because the set contains an outlier.
500
Based on the box plot, the ______ will most likely score 94% on the next test.

The Morning will most likely score 94% on the next test.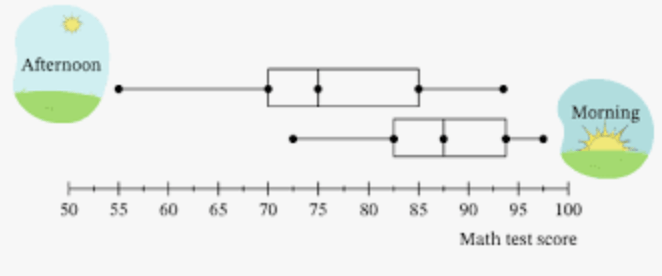
500

______ percent of runners were between 15 and 20.
______ percent of runners were between 20 and 45.
______ percent of runners were between 30 and 65.
______ percent of runners were between 20 and 65.

25 percent of runners were between 15 and 20.
50 percent of runners were between 20 and 45.
50 percent of runners were between 30 and 65.
75 percent of runners were between 20 and 65.
500
The median number of students per classroom is ___.
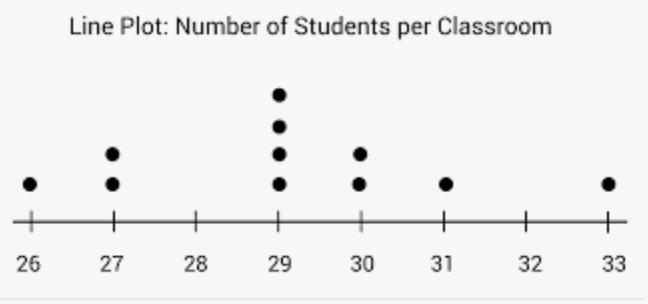
26, 27, 27, 29, 29, 29, 29, 30, 30, 31, 33
 The median number of students per classroom is 29.
500
Which store will most likely sell 60 wrist bands the next day?
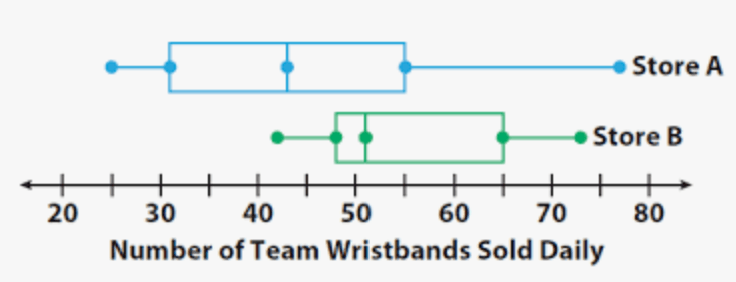

Store B