Statistics
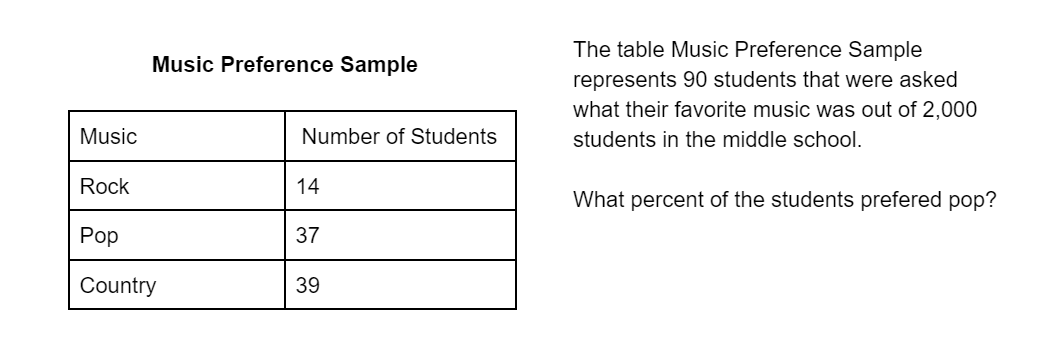
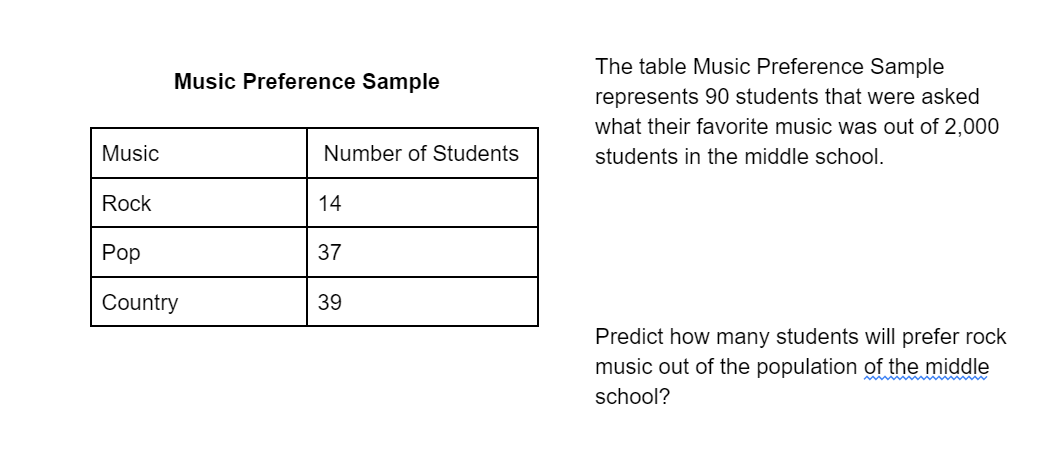
Population and Sample
Could be any amount?
Could be any amount?
Review Mix
100
What is the difference in median between the two sets of data?
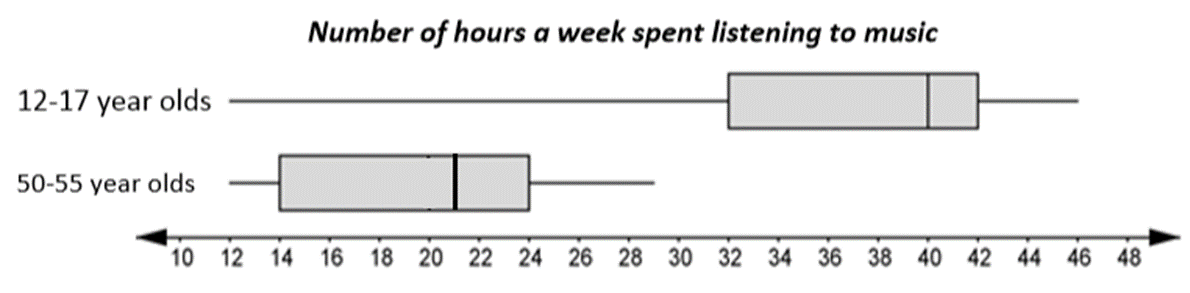
19
100
Determine whether the sample is biased or unbiased:
To estimate the number of students in your school who play a sport outside of school, you decide to survey the players on the boy’s basketball team.
Biased
100
When calculating the spread in data, which statistical measure is best?
A. Median
B. Interquartile Range
C. Range
D. Mean
A. Median
100

Which graph has a greater variation? Explain your reasoning.
Brand X - The data is more spread out
100
Is this a proportion?
NO
200
Steven chose a random sample of 10 cans of peanuts from two different brands, A and B. Each can of peanuts in the sample is the same size. He counted the number of peanuts in each can. The results are shown in the dot plots below:
Which brand has a greater variability in the number of peanuts in each can?
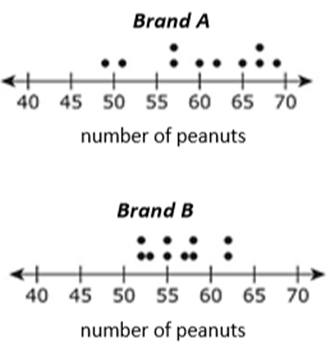
Brand A
200
Determine whether the sample is biased or unbiased:
The Yearbook Committee must choose among three different themes for this year’s yearbook. To help make their decision, they survey 100 random students at lunch.
Unbiased
200
What 2 pieces of information can NOT be found on a box and whisker plot?
Mean and Mode
200
Which graph is more consistent? Explain your reasoning.
Brand Y - The data is closer together
200
Each week, Ms. Jones goes to the grocery store and estimates that she will spend $94. This week, she actually spent $120. What is her percent error?
(Round your answer to the nearest tenth percent.)
21.7%
300
Box plots for chapter 6 test scores are shown.
What is difference of the medians between the two sets of data?
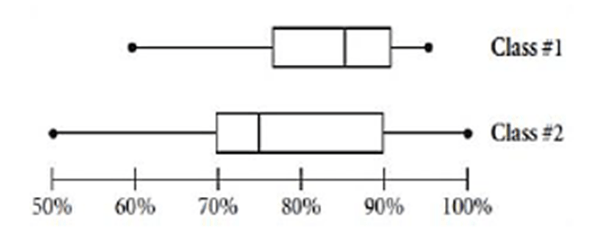
10%
300
A company with 160 employees wants to survey its employees to determine the most effective sales method. Which sample should the company use to arrive at the most reliable conclusion?
A. 20 employees from one sales department at one location
B. 20 employees from one sales department at each location
C. 20 employees from each sales department at one location
D. 20 employees from each sales department at each location
D
300
The 7th Grade math class took a survey to see how many students spent more than 45 minutes exercising a day. Students decided to do a random survey, determine whether the choices will be either bias or unbiased survey.
1)___________ Asking the 5th person that walks in the building in the morning
2)___________ Asking the 3rd person that exits the gym
3)___________ Asking the WCMS basketball team
4)___________ Asking every third person at a lunch table
1) Biased
2) Biased
3) Biased
4) Unbiased
300
41%
300
The shirt Eli wanted at the store was originally $25 but was marked down 20%. What is the sale price of his shirt?
$20
400
DAILY DOUBLE 800!!!
Marsh gathered samples for the average monthly temperatures of two cities and calculated the five number summaries.

What conclusion can she make?
About 50% of the sample temperatures for City A are between 32 and 45 degrees.
About 25% of the sample temperatures for City A are between 72 and 91.
The IQR for City B is greater than the IQR for City A.
The range for City B is greater than the range for City A.
B
400
A middle school has 220 students in 6th grade, 170 in 7th grade, and 100 in 8th grade.
The media specialist wants to know which books will be most popular among the students at her school, so she surveys a group of them. Which is the best sample?
A. 45 sixth graders, 35 seventh graders, 20 eighth graders
B. 20 sixth graders, 35 seventh graders, 45 eighth graders
C. 45 sixth graders, 40 seventh graders, 45 eighth graders
D. 20 sixth graders, 20 seventh graders, 20 eighth graders
A
400

a) 20%
b) twice as many people take health science than physics
c)24
d) about 2
400
About 311
400
The center on the basketball team scored 19 of the team's 98 points. What percent of the points did his team score?
80.6%
500
Two classes have a trivia contest. Each student is asked eight questions and is scored on the number of correct answers. The teacher creates a dot plot of the scores from 13 students in Class A and 12 students from Class B, as shown.
What is the change in the mean number from class A to class B (rounded to the nearest 10th)?
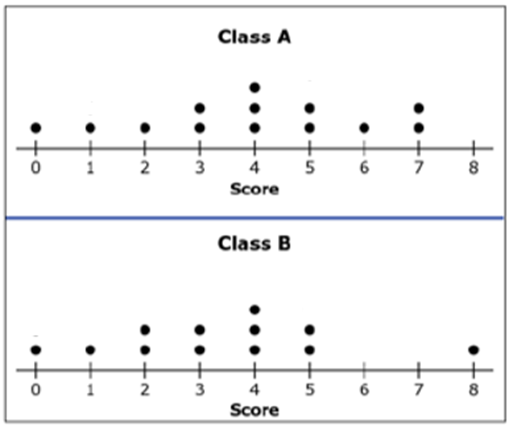
0.5
500
Maria owns a restaurant that is open 24 hours a day, every day for breakfast, lunch, and dinner. She offers a regular menu and a menu with daily specials. She wanted to estimate the percentage of her customers who ordered daily specials. She selected a random sample of 50 breakfast customers who ate at her diner over a three-month period. She determined that 28% of those customers ordered from the daily special menu.
Which statement is true about Maria’s sample?
A. The sample is the percentage of customers who ordered daily specials.
B. The sample might not be representative of the population because it only included breakfast customers.
C. The sample shows that exactly 28% of the customers ordered daily specials.
D. No generalizations can be made from this sample, as the sample size of 50 is too small.
B
500
Amy randomly selected 10% of the seventh-grade students in her school and asked them their favorite sport. Of the students surveyed, 30 chose football as their favorite sport. Based on the data, what is the most reasonable prediction of the number of seventh-grade students in her school who would choose football as their favorite season?
300
500

What is the IQR for class A?
9
500
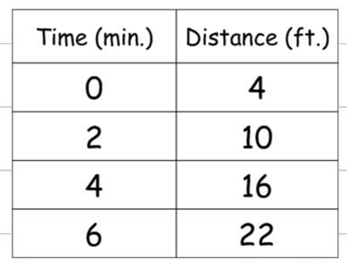
The graph below shows the relationship between the pounds of gummi bears bought at a candy store and the total cost, in dollars, for the gummi bears.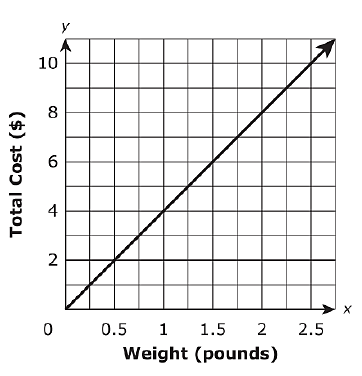
1. What is the unit rate as an ordered pair?
2. What does the point (0,0) represent on THIS GRAPH?
1.) (1,4)
2.) The weight of the gummi bears is 0 the cost is also $0