Population and Samples
Dot Plots
Box Plots
Comparing Plots
No Calculator
100
What does a circle graph have?
What is percents?
100
In the following dot plots, what is the most common length? AKA "Mode"
What is 31 in.
100
What is the median of the following box plot?

What is 21 points.
100
Which dot plot is more symmetrical? Top or bottom? 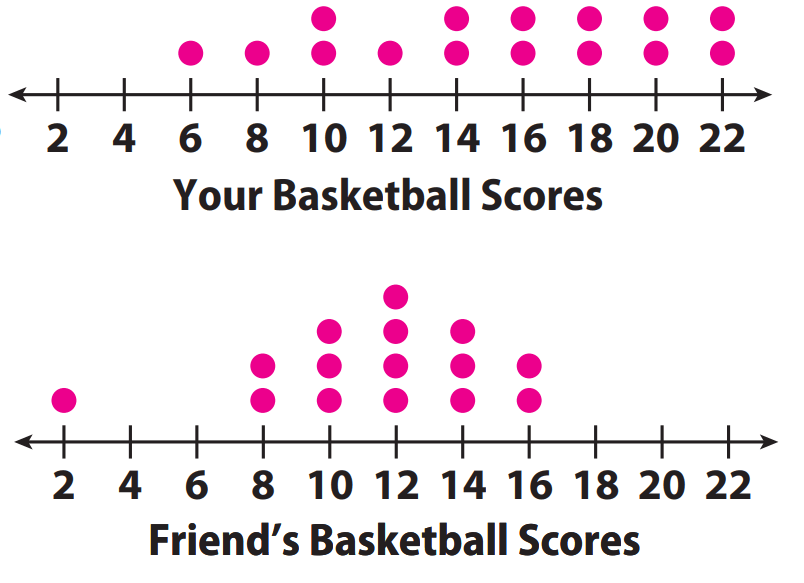
What is the bottom plot.
100
What is _____ in percent?
(1/4)
What is 25%
200
What does IQR stand for
What is interquartile range
200
In the following dot plots, what is the range? 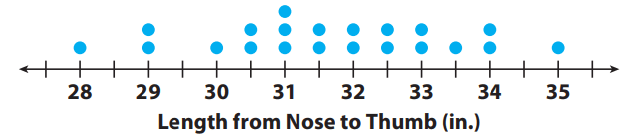
What is 7.
200
What is the minimum and maximum value in the box plot? 
What are 15 and 30.
200
What are the two medians of the box plots below? 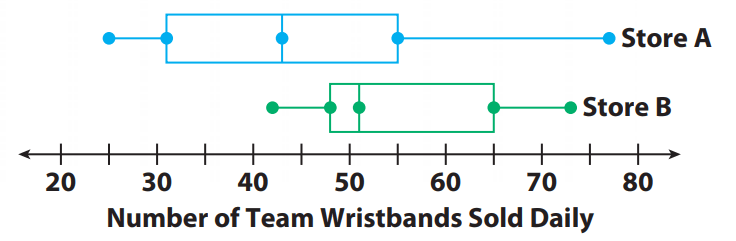
What are 43 and 51 (about).
200
What is 1/3 in decimal
.33 repeating
300
How do you calculate the range
What is subtract the max from the min?
300
In the following dot, describe the center of the median? 
What is 31.5 inches.
300
What is the Q3 - Q1 (IQR) of the data set? 
What is 10
300
What is the difference of the ranges?
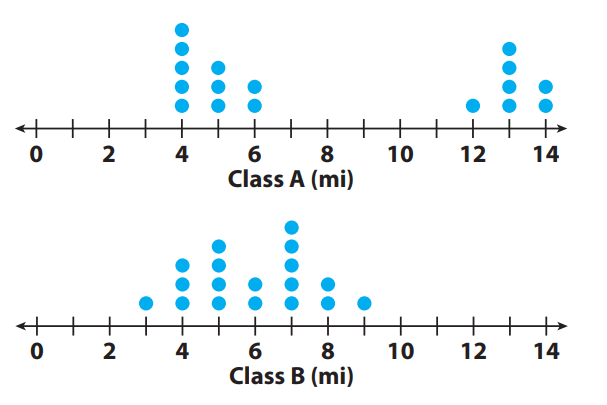
What is 4.
300
Divide
6/(2/5)
What is 15.
400
The mayor uses a random sample to estimate the average number of workers per block. She picks the following numbers out of 25:
56, 60, 50, 43, 62, 53
What is 54.
400
What type of data set is this graph 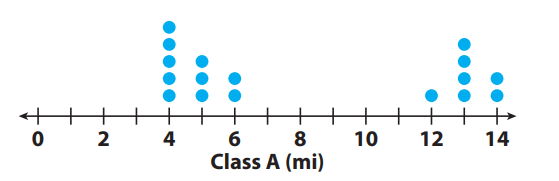
Uniformed
400
What is the Range? 
What is 15.
400
Which graph has a greater Q3? 
What is Store B.
400
What is 1/6 in percent?
What is 16.67%
500
On a six-sided number cube, each side has a number between 1 and 6. What is the probability of throwing a 3 or a 4?
2/6 or 1/3
500
Calculate the mean for the following dot plot.
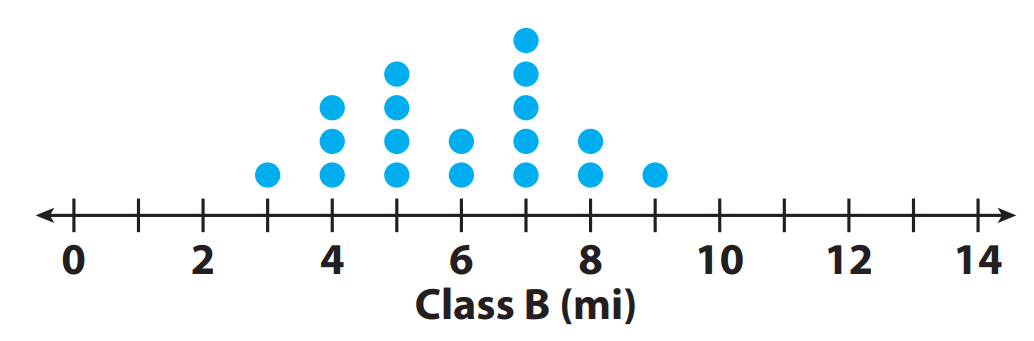
What is about 6 mi (5.94 mi).
500
What is the difference between the median and the range? 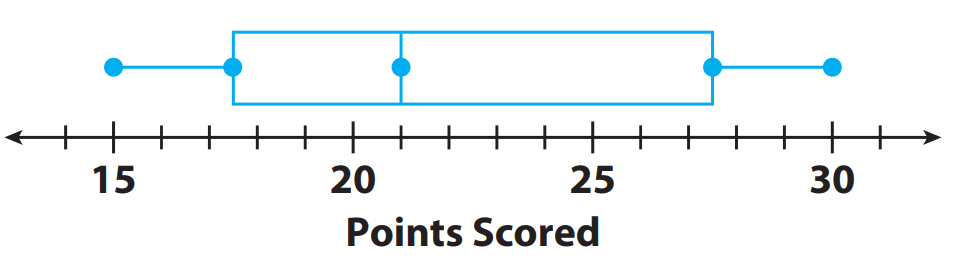
What is 6.
500
The IQRs for both graph is 10. TRUE or FALSE. 
What is true
500
What is the 5/8 in percent?
What is 62.5%