Box Plots
Dot Plots
Stem & Leaf
Histogram
Mean, Median, Mode, Range
100
In Box Plots we use Quartiles, how many quartiles are we separating the data into?
4
100
What is the mode of the following dot plot?
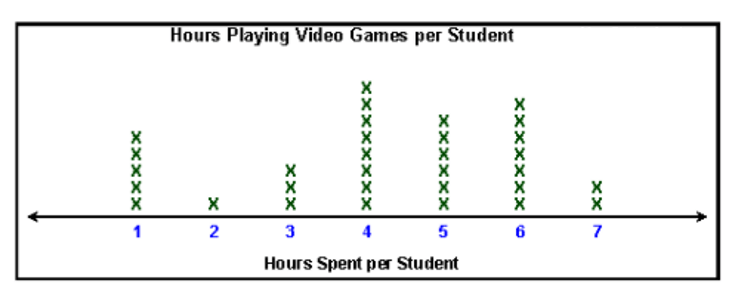
4 hours
100

What is the median of the plot above?
55
100
How many dogs weight at least 50 kg?
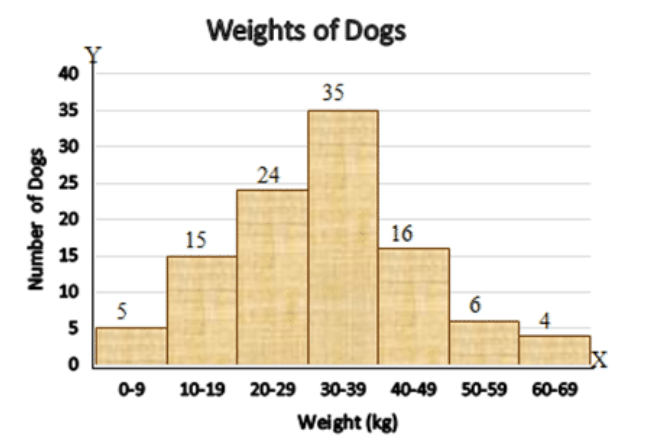
10
100
What is the mode of the following data?
2, 5, 9, 9, 8, 2, 3, 2
2
200
What percent of the data is more than the Lower Quartile?
75%
200
How many students played less than 3 hours?
6 students
200

How many students attended the camp?
15
200
How many dogs weigh less than 30 kg?

44
200
What is the mean of the following data?
2, 5, 9, 9, 8, 2, 3, 2
5
300
Below is a box plot showing Mr. Lingo's scoring for his basketball games. What is the interquartile range?
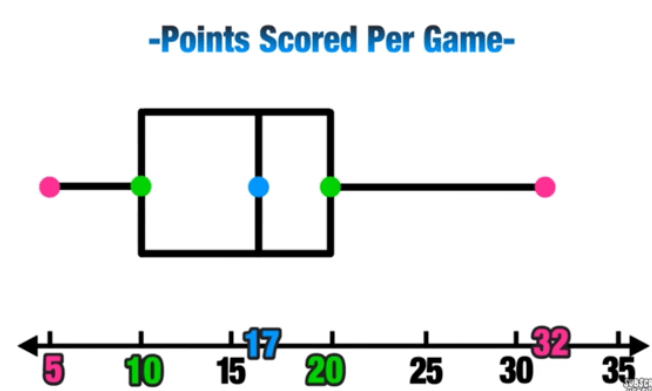
10
300
What is the range of the following dot plot?
6 hours
300
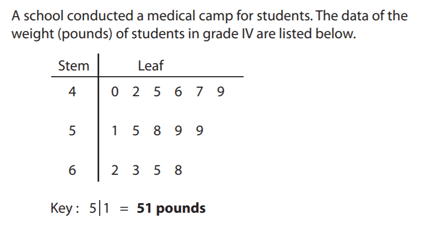
How many students weighed between 50 and 60 pounds?
5
300
How many lottery winners were between the ages of 20-29?
2
300
What is the median of the following data?
2, 5, 9, 9, 8, 2, 3, 2
4
400
What is the upper quartile for average minutes per night spent studying?
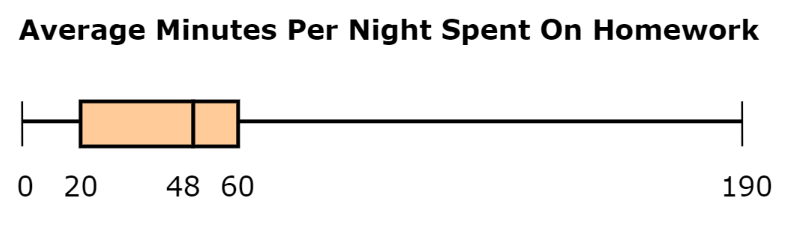
60
400
What is the median of the dot plot?

4 hours
400
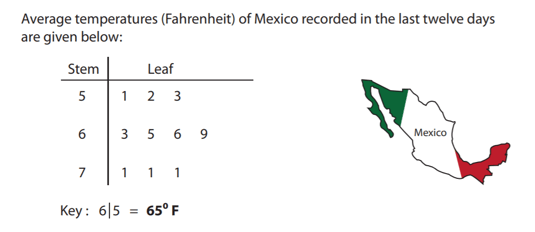
What is the range of temperatures?
20
400
How many lottery winners were at least 50 years old?
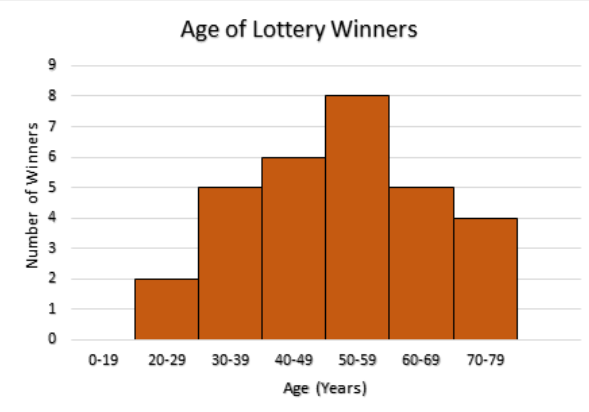
17
400
What is the range of the following data?
2, 5, 9, 9, 8, 2, 3, 2
7
500
The following box plot shows test scores for Mr. Feeney's class. What was the median test score in Mr. Feeney's class?
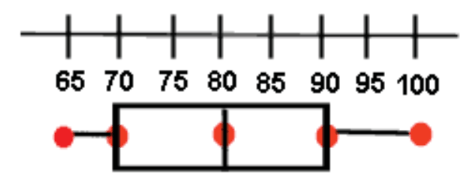
80
500
What is the mean of the following dot plot? Round to the nearest tenth. 
4.2
500

What percent of the days were above 70 degrees?
30%
500
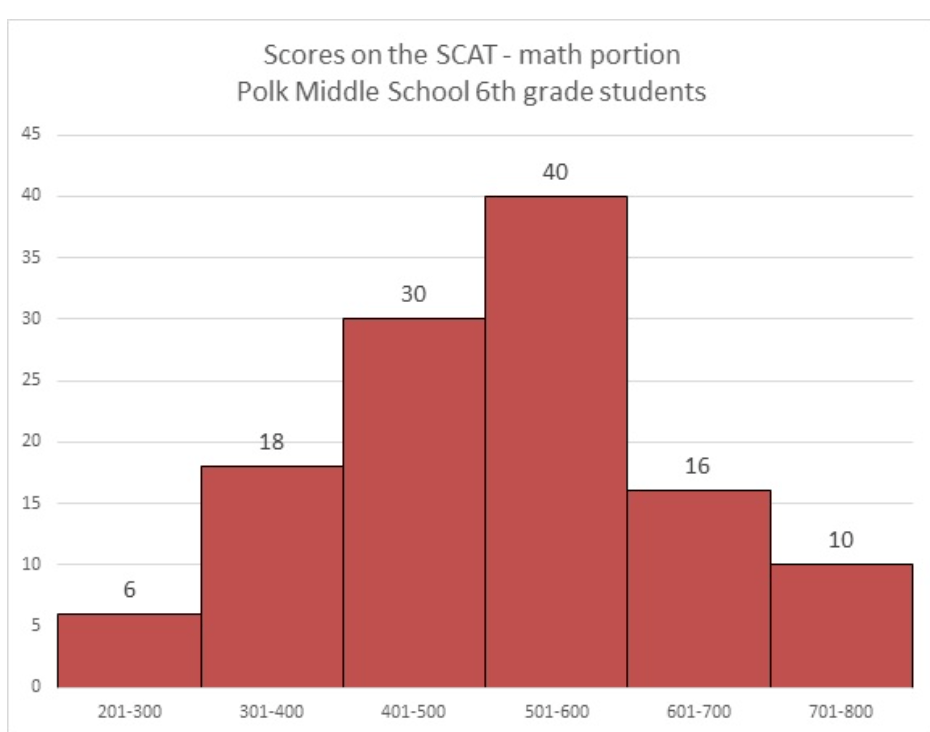
Carla outscored 101 other students on the math portion of her SCAT test. Which of these test scores could be hers?
260 360 460
560 660 760
660
500
What is the mean of the following data?
20, 50, 90, 90, 80, 30
60