Bar Graph
Tally Chart
Pictograph
What Type of Graph/Chart
Vocabulary
100
Which sport was the favorite?

Soccer
100
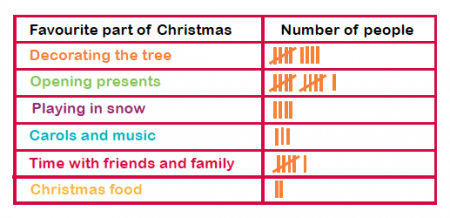 How many people liked decorating the tree most?
9
100
How many people voted total?
28
100
pictograph
100
 What is the title of this graph?
Birthday of Students by Month
200
How many people liked Basketball and softball?
10
200
How many more people liked opening presents than playing in the snow?
7
200
How many people voted for chocolate chip and ginger snap?
12
200
bar graph
200
What is the scale of this graph?
2's
300
How many people voted total?
22
300
How many people voted total?
35
300
How many more people liked peanut butter cookies than animal crackers?
4
300
tally chart
300
 How many books does the key tell you each picture of a book represent?
2 books
400
How many more people voted for soccer than for "other"?
6
400
How many less people liked Carols and music than decorating the tree?
6
400
How many people would have voted if the key said 5 instead of 2?
70
400
pictograph
400
What does the title of this graph tell you it is about?
Reading Competition Results
500
If softball had 6 more votes, how many more would it have than basketball?
4
500
If 4 more people voted for playing in the snow, how many people would like playing in the snow?
8
500
If 8 more people voted for ginger snaps how many more will have liked ginger snaps than animal crackers?
6
500

frequency table
500
 A label in this graph is "Insects". What are the categories of insects voted on?
Ladybug, ant, butterfly, mosquito