General Questions
Calculating Statistics
Describing Graphs
Regression Output
Interpreting Statistics
100
If you are asked to describe the relationship between two quantitative variables what attributes of the graph do you need to address?
Direction, Outliers, Form, and Strength
100
Calculate the Correlation Coefficient on the table below.
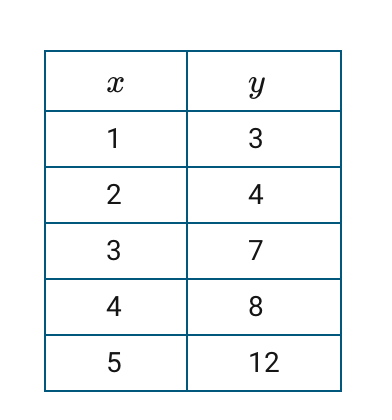
What is 0.98?
100
The scatterplot below relates SAT score to GPA. Describe the direction of the relationship in context.
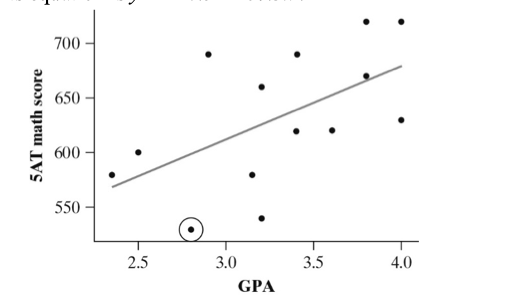
As students GPA increases, the SAT math score tends to increase as well indicating a positive association.
100
Dione records minutes of climbing time and number of floors climbed for six exercise sessions. Computer output and a residual plot from a linear regression analysis of the data are shown below. Identify the slope and y-intercept theLSRL.
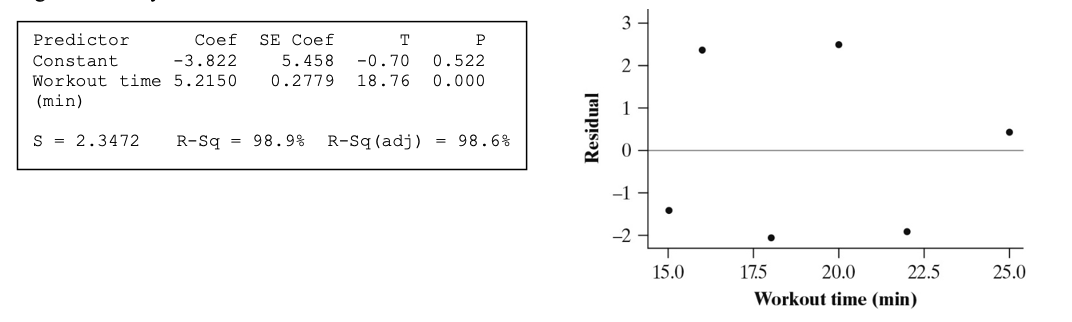
b=5.2150 (slope)
a=-3.822 (y-int)
100
The relationship between the number of turnovers and the number of points scored for players in the NBA was studied. The correlation for the data produced a correlation coefficient of 0.92. What information does r tell is in context?
The relationship between turnovers and points scored is positive and strong.
200
What are the 3 choices in describing the direction of scatterplot?
What is Positive association, Negative association, No association?
200
Youssef, a environmental researcher, released water across a test bed at different flow rates and measured the amount of soil washed away. The following table gives the flow (in liters per second) and the weight (in kilograms) of eroded soil:
Flow rate 0.31 0.85 1.26 2.47 3.75
Amount of eroded soil 0.82 1.95 2.18 3.01 6.07
What is the LSRL in context?
hat soil=0.4507+1.389(flow rate)
200
Are there any obvious outliers in the scatterplot relating GPA and SAT?
What is there does not appear to be any outliers?
200
What is Ms. Hogan's favorite football team?
What is the Green Bay Packers?
200
A scatterplot of 13 different flights from Orlando on a particular airline suggests that the relationship between x = distance (miles) and y = air fare (dollars) is roughly linear. The computer output summarizes this relationship. Identify the slope and interpret in context of the problem.
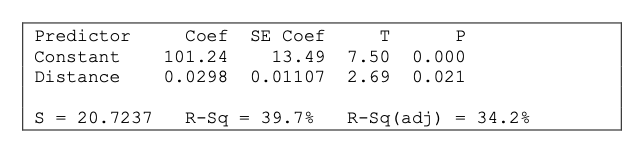
What is b=0.0298. For every additional mile of distance, the predicted air fare increases by 0.0298 dollars.
300
What range of values can the correlation coefficient take on?
What is -1 to 1?
300
Youssef, a environmental researcher, released water across a test bed at different flow rates and measured the amount of soil washed away. The following table gives the flow (in liters per second) and the weight (in kilograms) of eroded soil:
Flow rate 0.31 0.85 1.26 2.47 3.75
Amount of eroded soil 0.82 1.95 2.18 3.01 6.07
What is the coefficient of determination?
What is 0.9351?
300
Describe the form and strength of the scatterplot below relating GPA and SAT math scores.
What is linear and moderate.
300
The following output and scatterplot describe the relationship between the fastest serve speed (in kilometers per hour) and the height (in meters) of 21 current male professional tennis players. Find the LSRL.
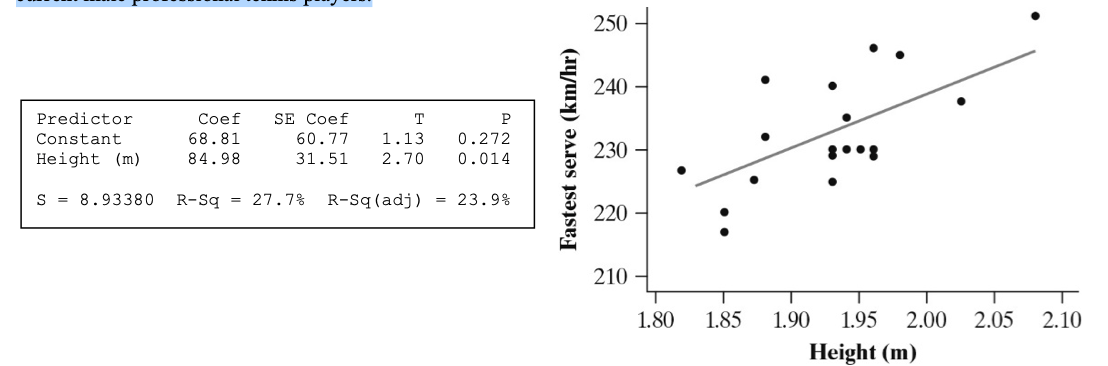
What is
hatservespeed=68.81+84.98(height)
300
A scatterplot of 13 different flights from Orlando on a particular airline suggests that the relationship between x = distance (miles) and y = air fare (dollars) is roughly linear. The computer output summarizes this relationship. Identify the y-intercept and interpret in context of the problem.
What is a=101.24 dollars. When the distance traveled is 0 miles, the predicted air fare is 101.24 dollars.
400
A Gators Dockside server records the total bill and the amount of the tip received by 5 individuals who dined alone. Here are the data:
Total $4.50 $5.79 $6.25 $4.62 $6.35
Tip $0.75 $1.00 $0.75 $0.58 $1.00
What is the explanatory variable and what is the response variable?
Explanatory is total bill and the response is the tip.
400
For children between the ages of 15 months and 26 months, there is an approximately linear relationship between height and age. The relationship can be represented by yˆ = 64.93 + 0.63x, where y represents height (in centimeters) and x represents age (in months).
Matthew is 21 months old. What is his predicted height?
What is 78.16cm?
400
Can we say that having a high GPA causes higher SAT math scores? Explain.
What is no, we can only say there is an association or relationship. Causation can only be established through a well-designed experiment.
400
The following output and scatterplot describe the relationship between the fastest serve speed (in kilometers per hour) and the height (in meters) of 21 current male professional tennis players. Calculate the residual for a player who is 1.85 meters tall and had a fasted serve of 220 KM per hours.
What is -6.023 KM per hours.
400
Maya records minutes of climbing time and number of floors climbed for six exercise sessions. Computer output and a residual plot from a linear regression analysis of the data are shown below. Interpret the standard deviation of the residuals.
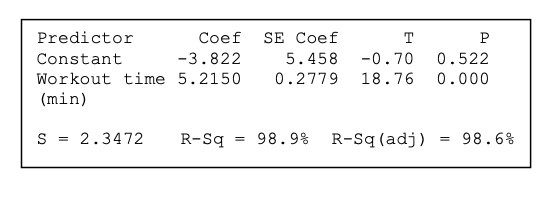
What is the typical error in predicting the number of floors climbed is 2.3472 floors.
500
The correlation r between the total bill and tip is r=0.67. How would r change if the total bill amounts were reduced by 10%?
What is it would stay the same.
500
Calculate the standard deviation of the residuals on the table below.
What is S=0.8944.
500
Here is a residual plot relating income to child mortality. Is a linear model appropriate for this data?Explain.
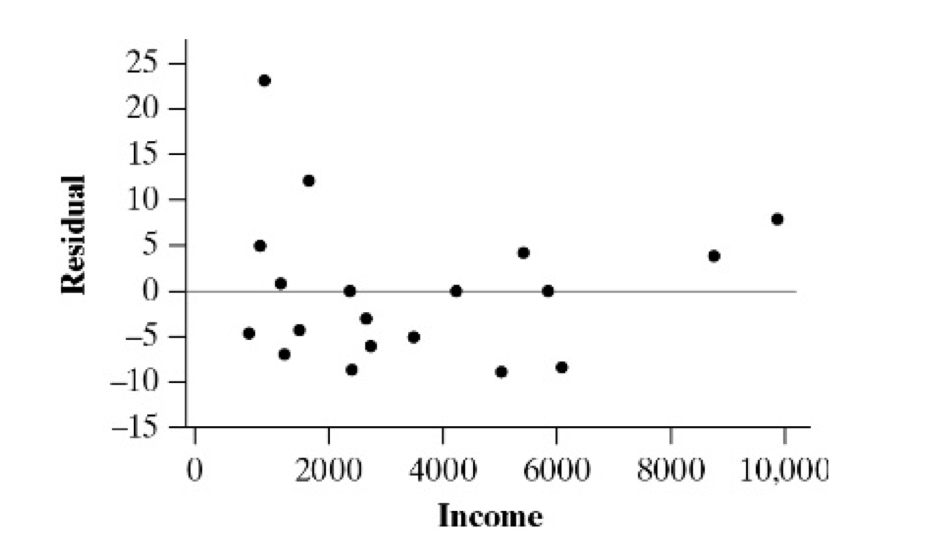
What is no, there appears to be left-over curvature in the residual plot indicating the relationship is not linear.
500
A server at Gators Dockside records the total bill and the amount of the tip received by 5 individuals who dined alone. Here are the data:
Total $4.50 $5.79 $6.25 $4.62 $6.35
Tip $0.75 $1.00 $0.75 $0.58 $1.00
Calculate and interpret a residual for the person who spent $6.25 and tipped 0.75.
What is residual= -0.17
A person who had a bill of $6.25 and tipped $0.75 tipped $.17 below what was predicted.
500
Maya records minutes of climbing time and number of floors climbed for six exercise sessions. Computer output and a residual plot from a linear regression analysis of the data are shown below. Interpret the coefficient of determination.
What is 98.9% of the variation in floors climbed can be explained by the number of minutes of workout time.