Statistical Questions
Mean, Median, Mode, and Range
MAD
Dot Plots and Box Plots
Frequency Tables and Histograms
100
True or False: The question, "What were the quiz scores of the last three periods?", is a statistical question.
True
100
Find the median, mode, and range of the following set of data:
8, 5, 3, 6, 2, 4, 6
Median-5
Mode-6
Range-6
100
What is the first step you need to do in order to find the mean absolute deviation?
Find the mean.
100

Describe the dot plot.
Symmetric
Peaks at 31 and 32
Cluster from 26 to 35
Gap from 22 to 25
Outlier at 21
100
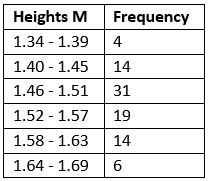
What are the interval lengths (bin widths)?
0.06
200
Give the definition of a statistical question.
A question that investigates some part of the real-world and has a variety of responses.
200
Find the mean of the following set of data:
8, 5, 3, 6, 2, 4, 6, 12
5.75
200
The mean of the following set of data is 16.
19, 14, 16, 18, 13
What is the sum of the distances that each number in the data set is away from the mean?
10
200
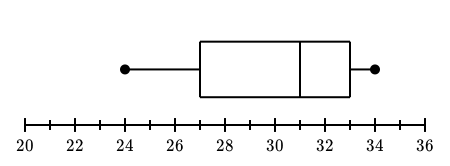
What numbers fall in the 25-75% on the box plot?
27 to 33
200
How many heights are between 1.40M and 1.63M?
78
300
True or False: Yes/No questions are not considered statistical questions.
False
300
The number of hours Nancy worked this week for the past 5 days is 8, 6, 5, 9, 8.
What is Nancy's average amount of hours worked?
7.2 hours
300
If you have a data set of 8 numbers and the sum of the distances each number in that data set is away from the mean is 14, what is the MAD?
1.75
300
Name the minimum, maximum, Q1, Q2, and Q3 for the following set of data:
17, 19, 13, 14, 14, 18, 15, 11, 11, 18, 22
Minimum-11
Maximum-22
Q1-13
Q2-15
Q3-18
300
Make a histogram for the frequency table.
Show answer on whiteboard.
400
Pick out ALL of the statistical questions in the following set of questions:
1) What are all of the months that begin with a J?
2) Who is the King of England?
3) When is the next Olympics?
4) Who has competed in the 100m race in the last 8 Olympic games?
5) Buckeye Nation, will you watch the game Saturday?
Questions 1, 4, and 5
400
Find the mean, median, mode, and range of the following set of data:
1.6, 1.4, 1.2, 1.9, 0.9
Mean-1.4
Median-1.4
Mode-No mode
Range-1
400
Find the MAD for the following set of data:
25, 23, 20, 29, 23
2.4
400
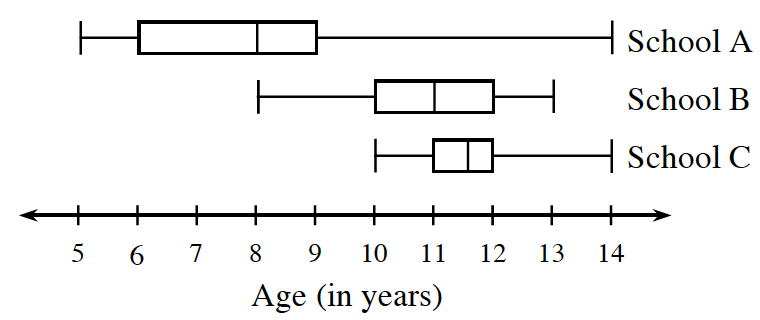
What is the average of the quartile 1 values?
9
400
What is the difference in heights of 1.51M or shorter compared to 1.52M and taller?
10
500

Write a statistical question for the following dot plot.
Answers may vary.
500
The mean of the following data set is 25.
26, 28, 20, 27, 26, ?
What is the missing number in the data set?
23
500
Find the MAD of the following set of data:
0.8, 0.7, 0.9, 0.6, 1.3, 0.5
0.2
500

What is the median for this dot plot?
4.5
500
:max_bytes(150000):strip_icc()/Histogram1-92513160f945482e95c1afc81cb5901e.png)
Make a frequency table for the above histogram.
Show answer on whiteboard.