Stem and Leaf Plots
Histograms
Histograms 2
Circle Graphs
Line Plot
100
How many people scored less than 40 Percent?
9
100

How many students have exactly 2000 songs on their phone?
Unknown
100
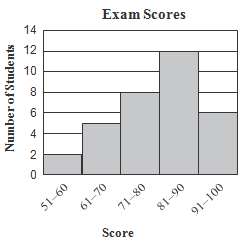
How many more students scores 71-80 than 51-70?
1
100
Which activity does this person spend the most time doing?
https://d138zd1ktt9iqe.cloudfront.net/media/seo_landing_files/geetha-e-pie-charts-05-1602836405.png
Sleeping
100

What was the most common number of Candy Bars Purchased?
5
200
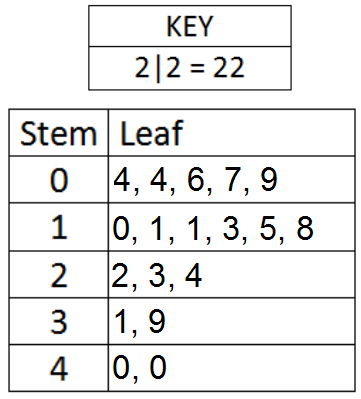
What is the median number on this stem and plot?
35.5
200
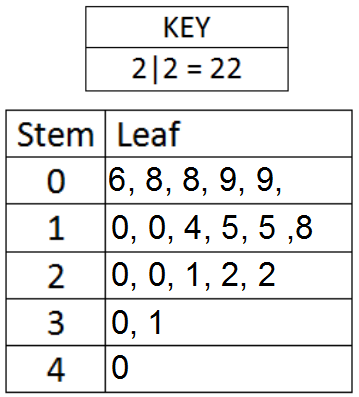
How many students got less than a 91 on their test?
27
200

How many people have 9 or less pets?
12
200
What two activities account for half of their time?
https://d138zd1ktt9iqe.cloudfront.net/media/seo_landing_files/geetha-e-pie-charts-05-1602836405.png
School and Misc
200
How many people bought 3 or less candy bars?
6
300
What is the range of this stem and leaf plot?
65
300
Which line plot matches this histogram?
C
300
Troy needs to create a histogram. Which set of data would be the most appropriate?
A
B
C
B
300

What percent voted for soccer?
25
300
How many more people bought 5-8 candy bars than 0-3
3
400
How many students score between 1-10
6
400
Using the image below, which set of data would be most appropriate to create a histogram? 
B
400
What percent of students have 500-999 songs on their phone
15 Percent
400
What percent voted for football and baseball?
41.6 percent
400
What is the median?
5
500
How many students scored between 1-20 points?
13
500
What percent of people have 15-19 pets?
37.5 %
500
What percent of students have more than 1500 songs on their phone?
55 Percent
500
If their monthly budget is 2,500 how much money do they spend on clothes?
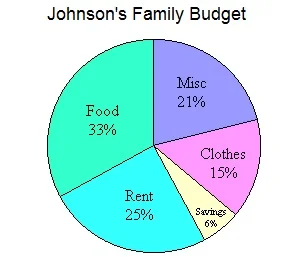
375 Dollars
500
What is the average (mean) number of candy bars purchased?
4.7 or 5 if you round